Overall the current dashbord setup consist of dashboards for each function.
The main functions are:
-
Sales
-
Marketing
-
Support
-
CSM
-
Management
Under each we do have sub-dashboards, which will be walked through under each section
Also each country has their own, so they only have to see each others numbers
This mean the Head of sales dashboard when searching looks like this
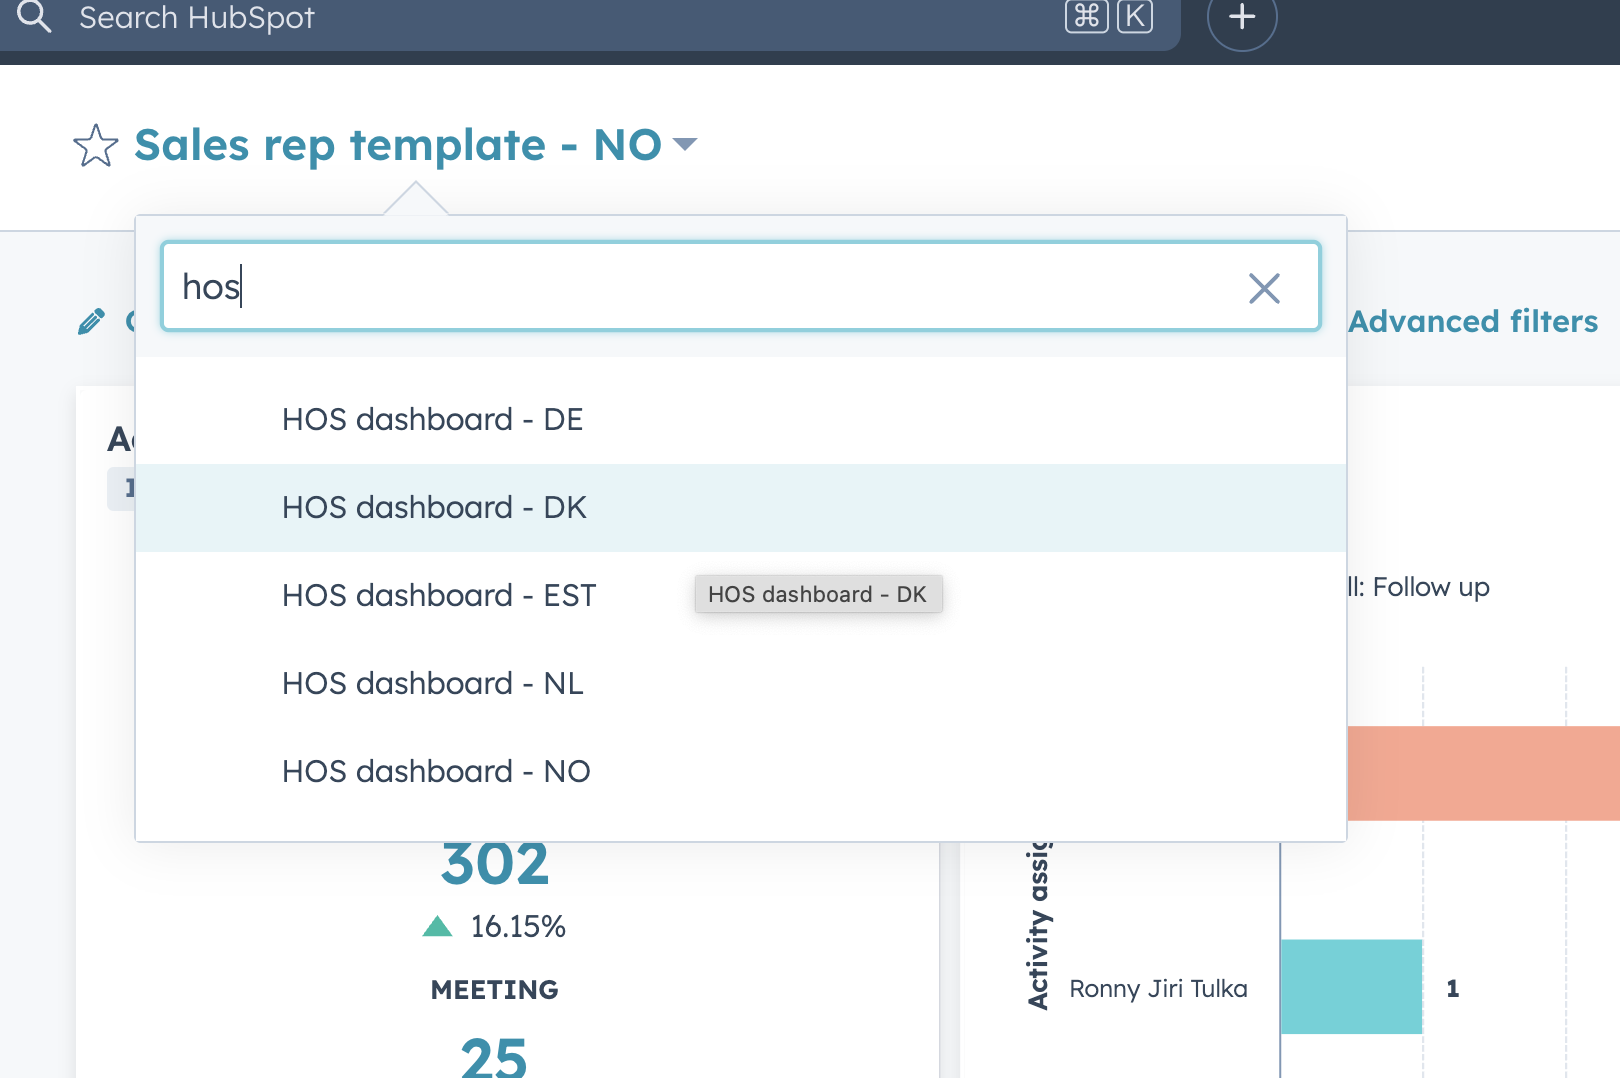
.png?width=670&height=446&name=image%20(9).png)
Sales dashboards
-
Sales rep template
-
Head of sales dashboard
-
SDR template
1. Sales rep template
Sales rep template - Example from NO market here https://app-eu1.hubspot.com/reports-dashboard/145462006/view/109010786/196861444
There is a version for each country with same name and then country short after.
The overall use case for this template, is to give sales an overview of how they are doing across activies, deals, pipeline, forecast, sold MRR & non-recurring and conversion rate
Activities, calls, email, meeting
Sales opportunities generated
Forecasted MRR per rep this year
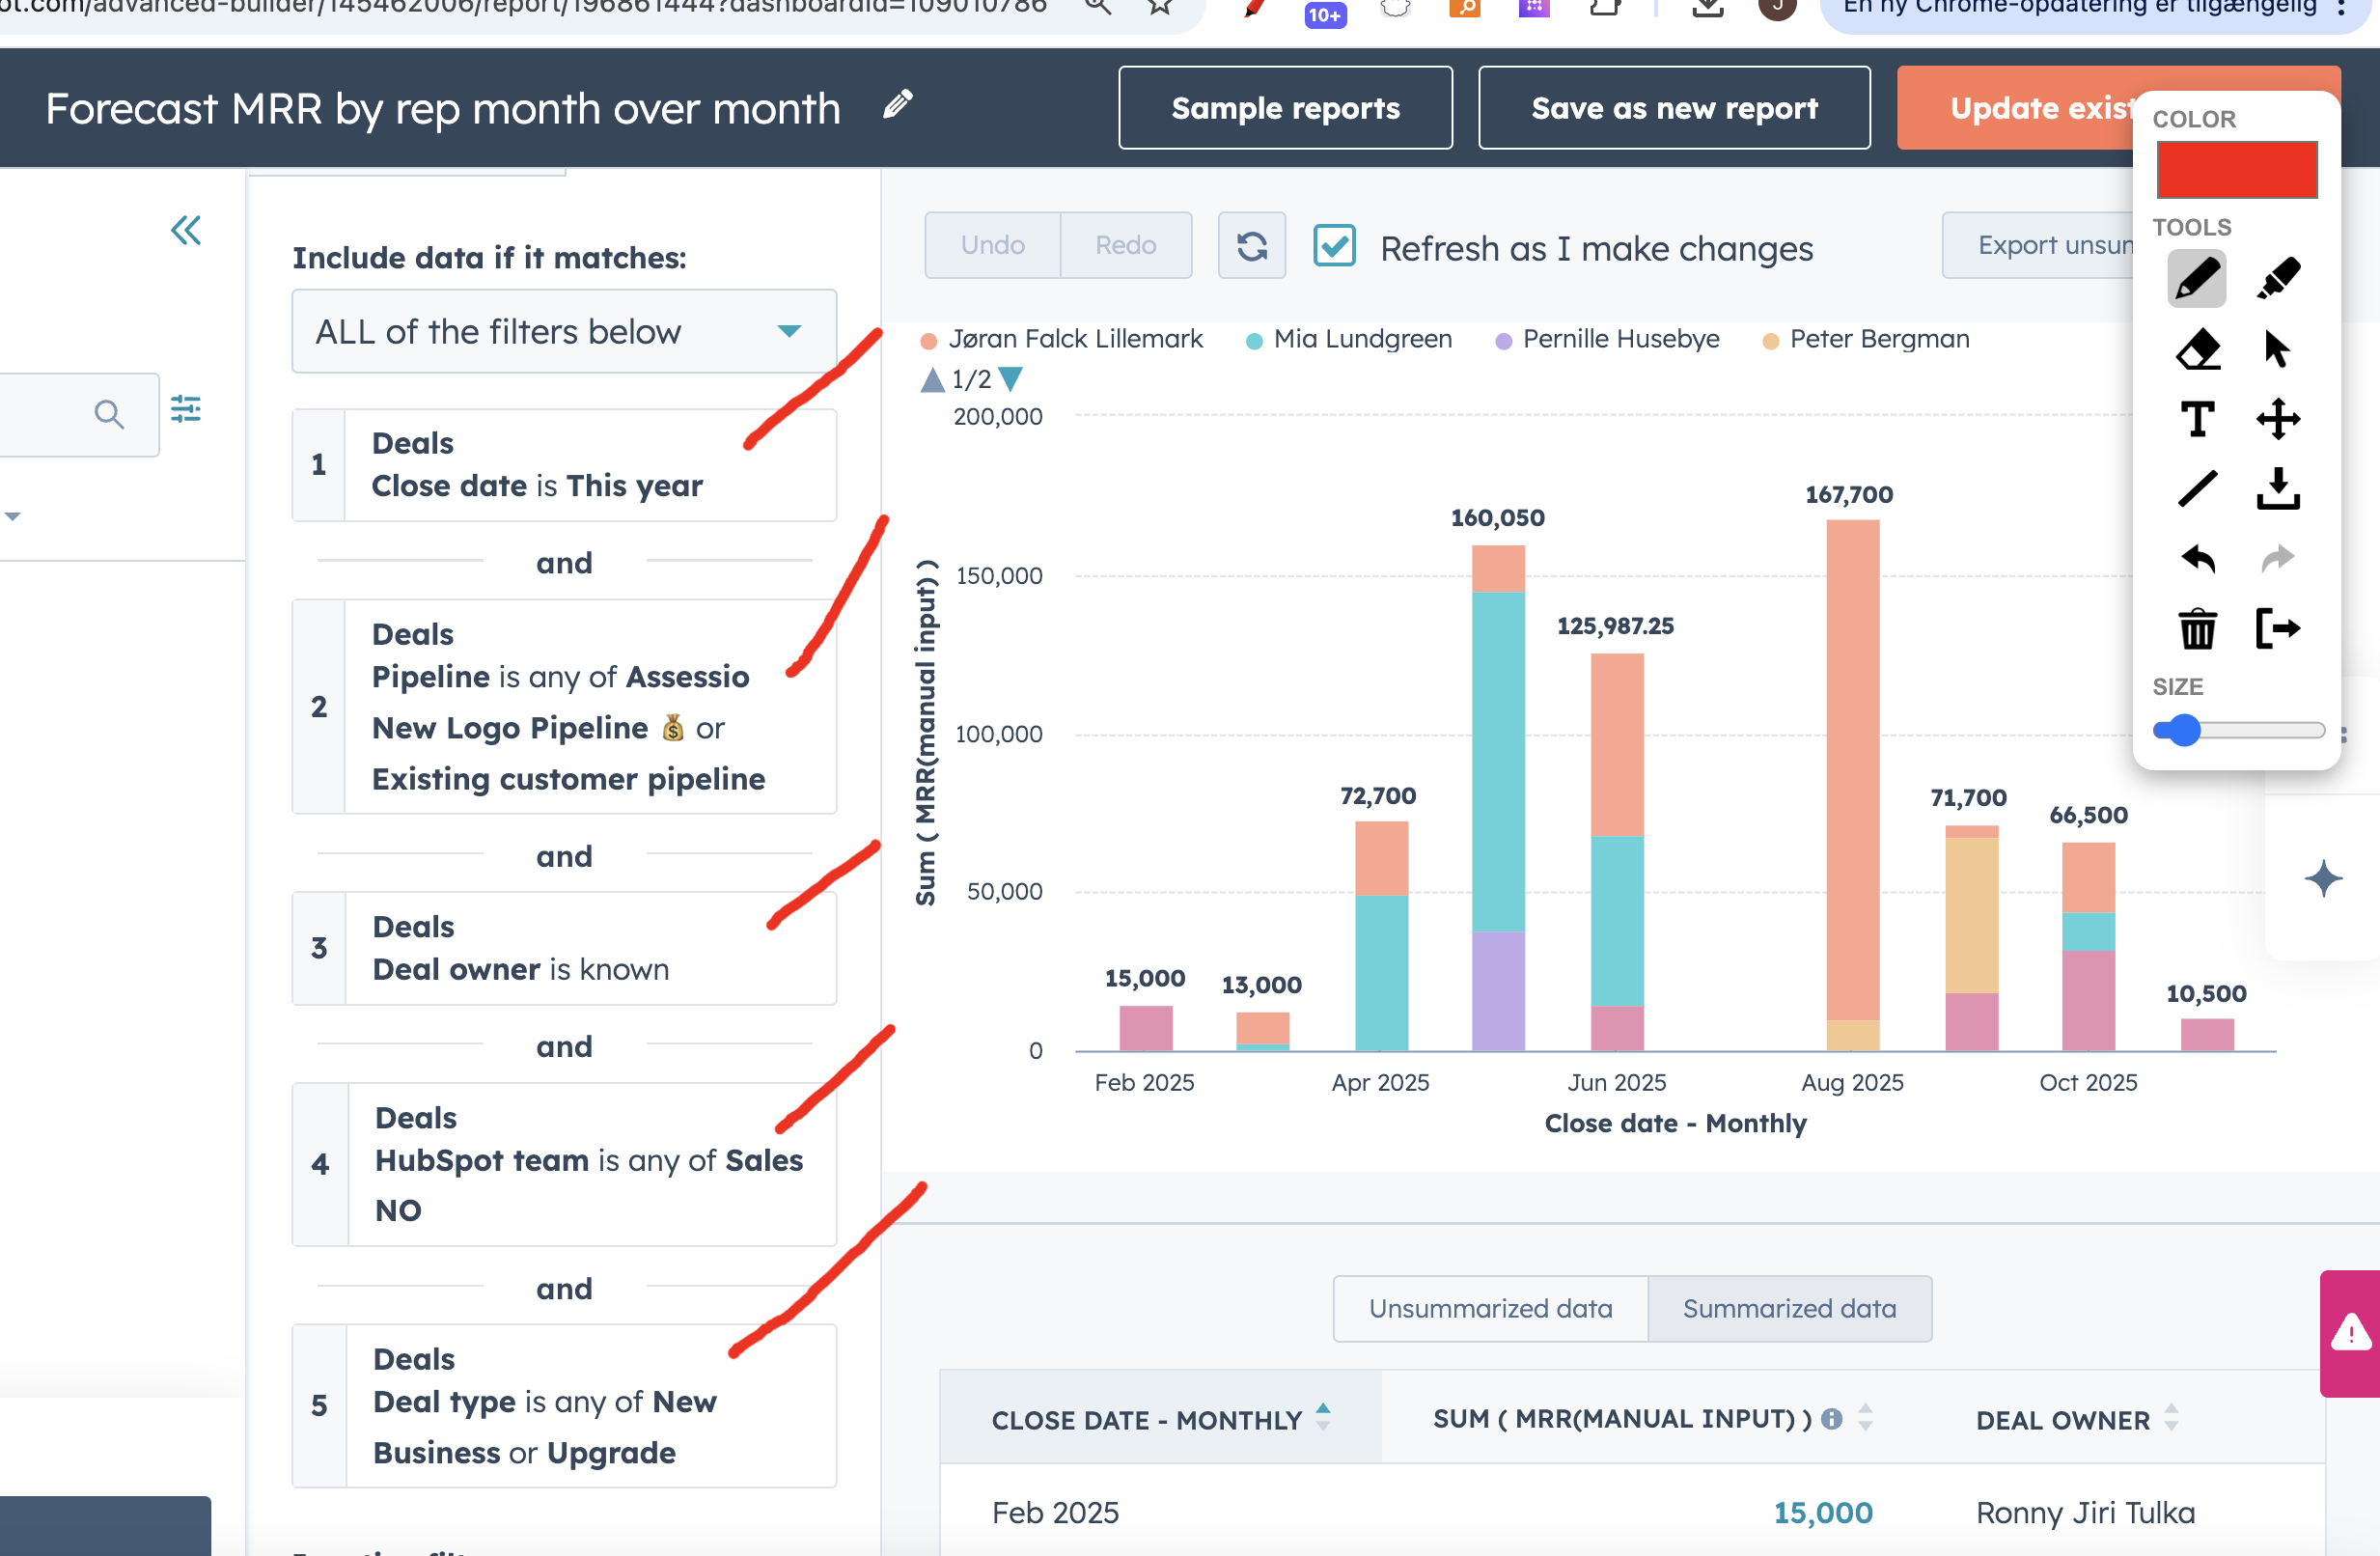
Forecasted MRR per rep month over month
Closed won by rep month over month
For the part off the business where we have it - sold vs goal MRR
Sold vs goal non-recurring
Pipeline coverage - how many times is your current pipeline over your budget
Avg time to close and Average value per customer
Deal funnel & conversion rates step by step
Target accounts by rep
The revenue part of the reports are built around these filters - as we see only new business or upgrades as "new" MRR
The pipelines are New business and Existing customer and deal type is new or upgrade
Some countries has more clear departments for Sales and CS, other countries it is dual roles. That affects the way their reports are setup. Norway has both roles and therefor we are looking at both new logo and existing customer pipeline
.png?width=670&height=438&name=image%20(10).png)
2. Head of sales dashboard
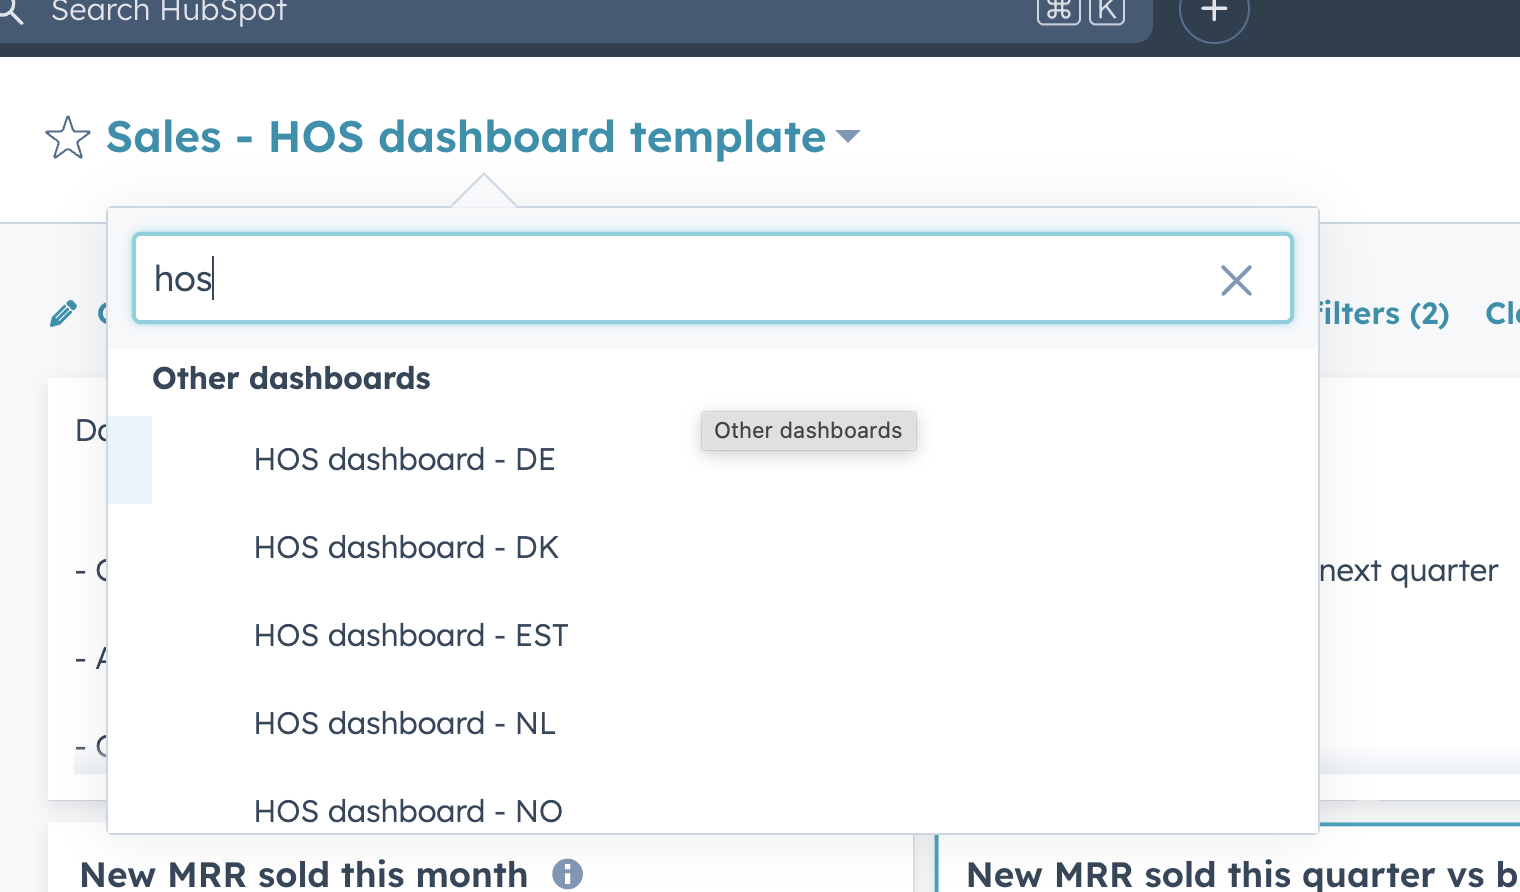
See template here HubspotReports dashboard
Note there is one dashboard per country and naming convention is - HOS dashboard - Country language code
.png?width=670&height=393&name=image%20(11).png)
The goal of this dashboard, is to give the Head of sales in each country, an overview of all:
-
Activities
-
New deals created
-
Forecast on monthly, quarterly and yearly basis
-
See rep performance against goal
-
Dive into their pipeline and do analysis
Full overview of what the reports:
- Overall important numbers - New MRR/ARR this month + quarter - forecasted this + next quarter
- Activity leaderboard
- Calls, emails, meetings booked
- Meetings held leaderboard
- New deals created by owner
- Sources of new deals
- Pipeline forecast
-
Forecast per product - missing -> will be created when Zuora and Vloxq is live
- Won vs budget this quarter
-
Won customers by segment & industry
- Pipeline conversion rate
- What changed in the pipeline?
- Disqualified leads from marketing overview
- Deal loss reasons
Important reports and filters
Only live for NL, DE and NO as a test → can be rolled out for rest of the countries if test goes well.
This is done in Databox a external reporting tool, as a test with NO and Milo. HubSpots own goals could not display in reports like this, so we built kpi reports for all sales people in the mentioned countries.
.png?width=670&height=338&name=image%20(12).png)
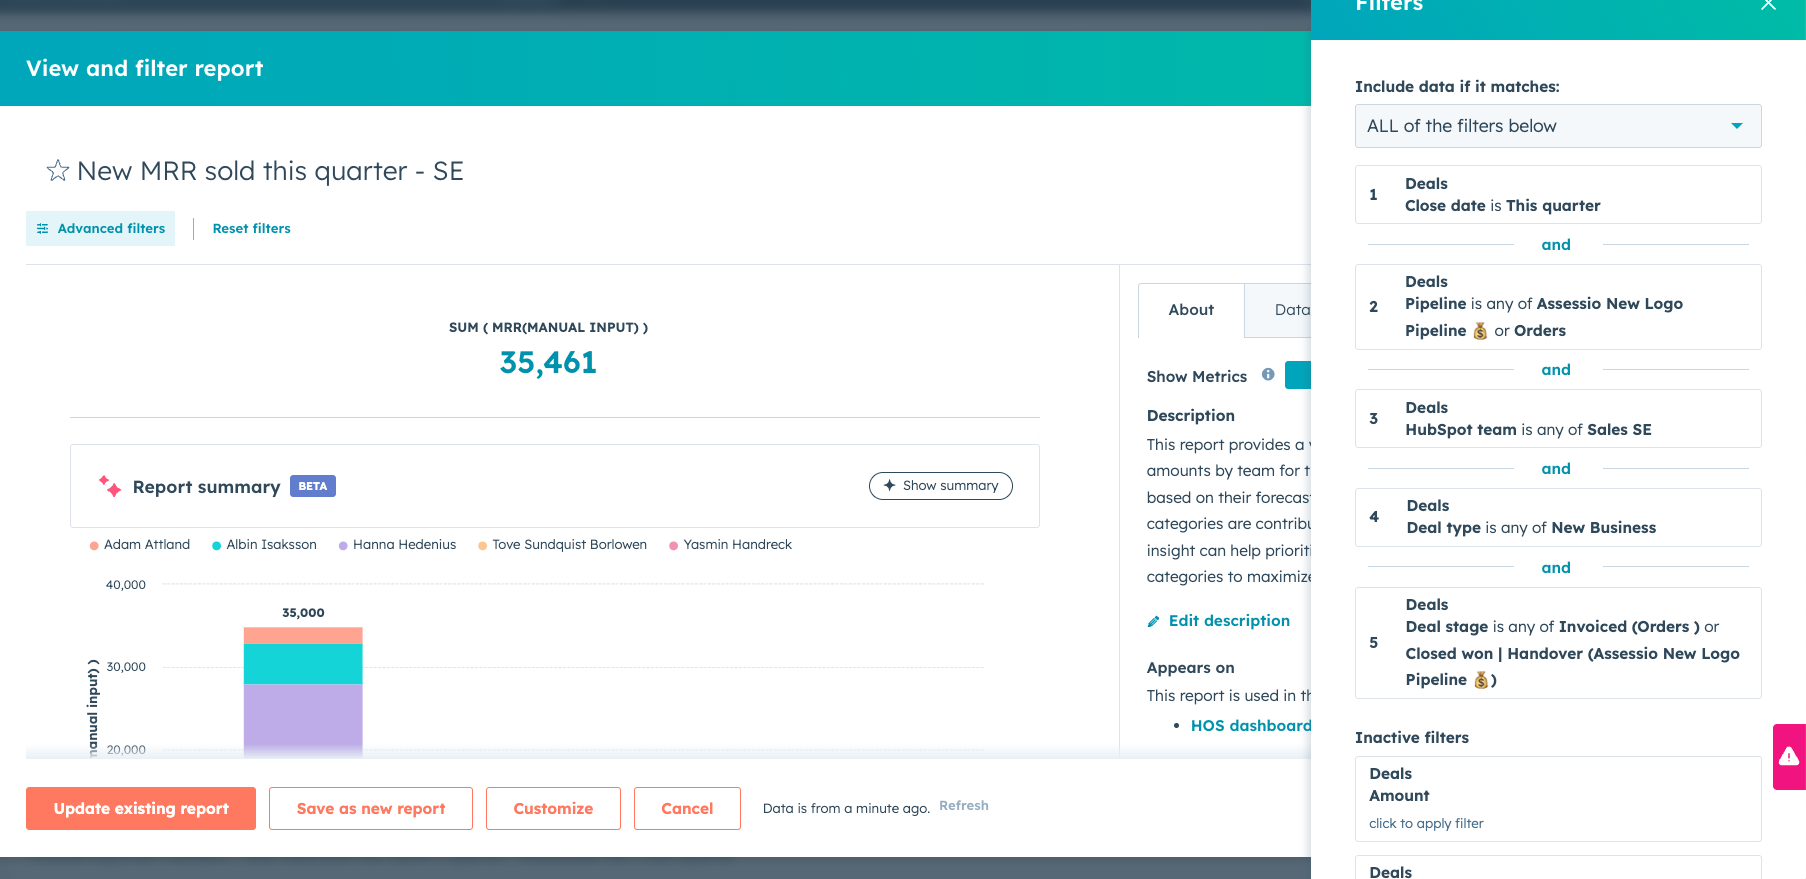
The main revenue reports are using this filter and is not looking at "upgrades" in the Existing customer pipeline.
.png?width=670&height=326&name=image%20(13).png)
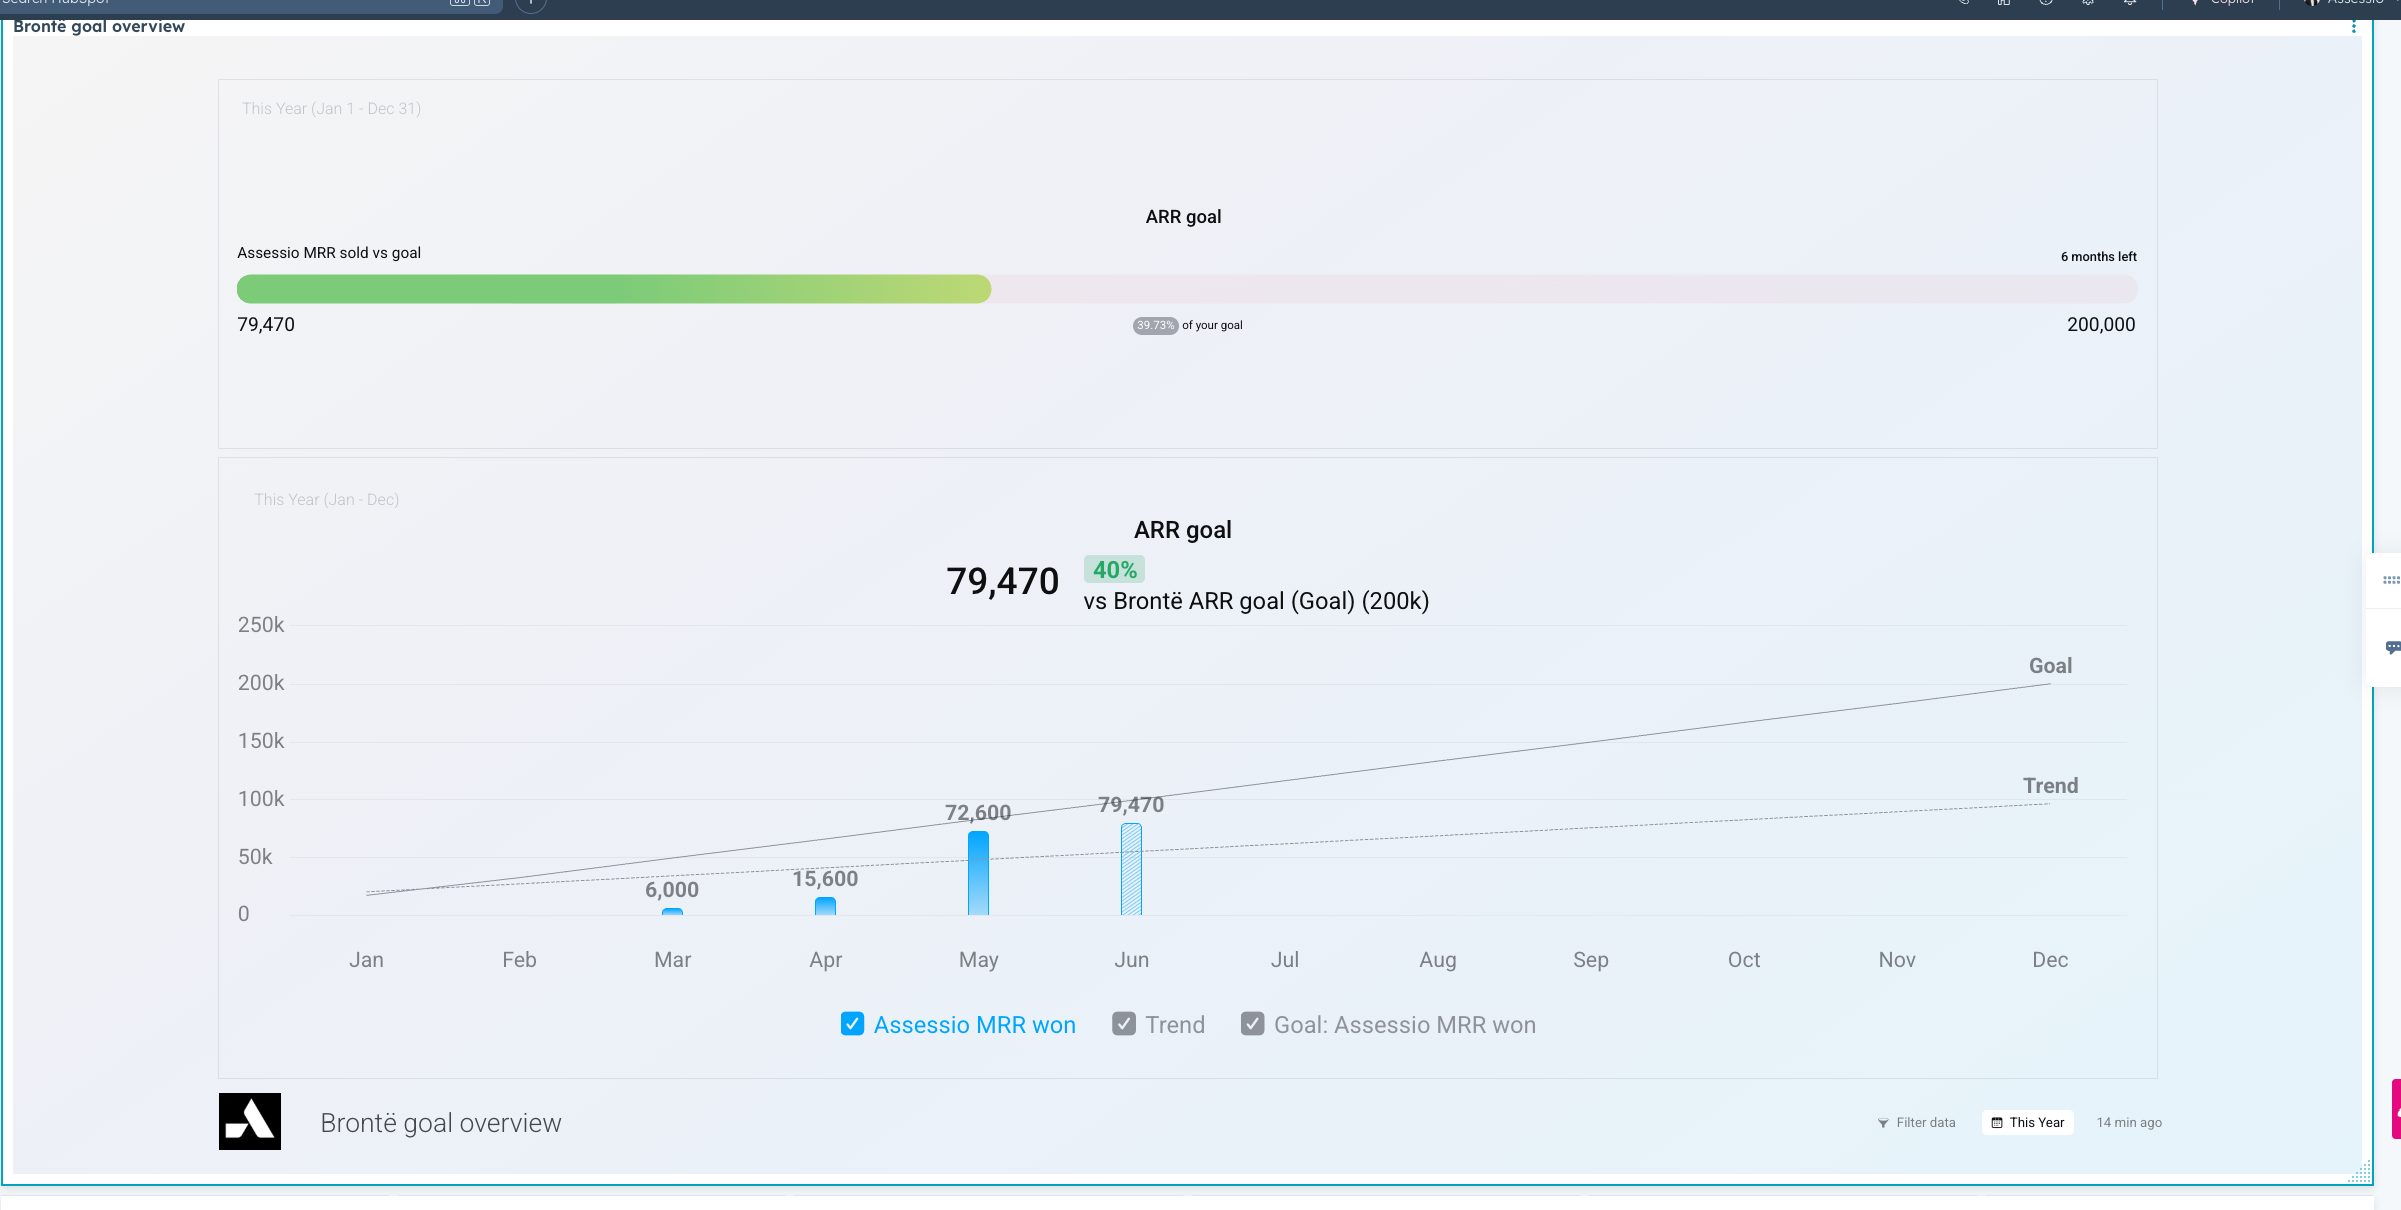
Some reports does not yet have a budget, because we have not received such.
See example here - this could have a budget
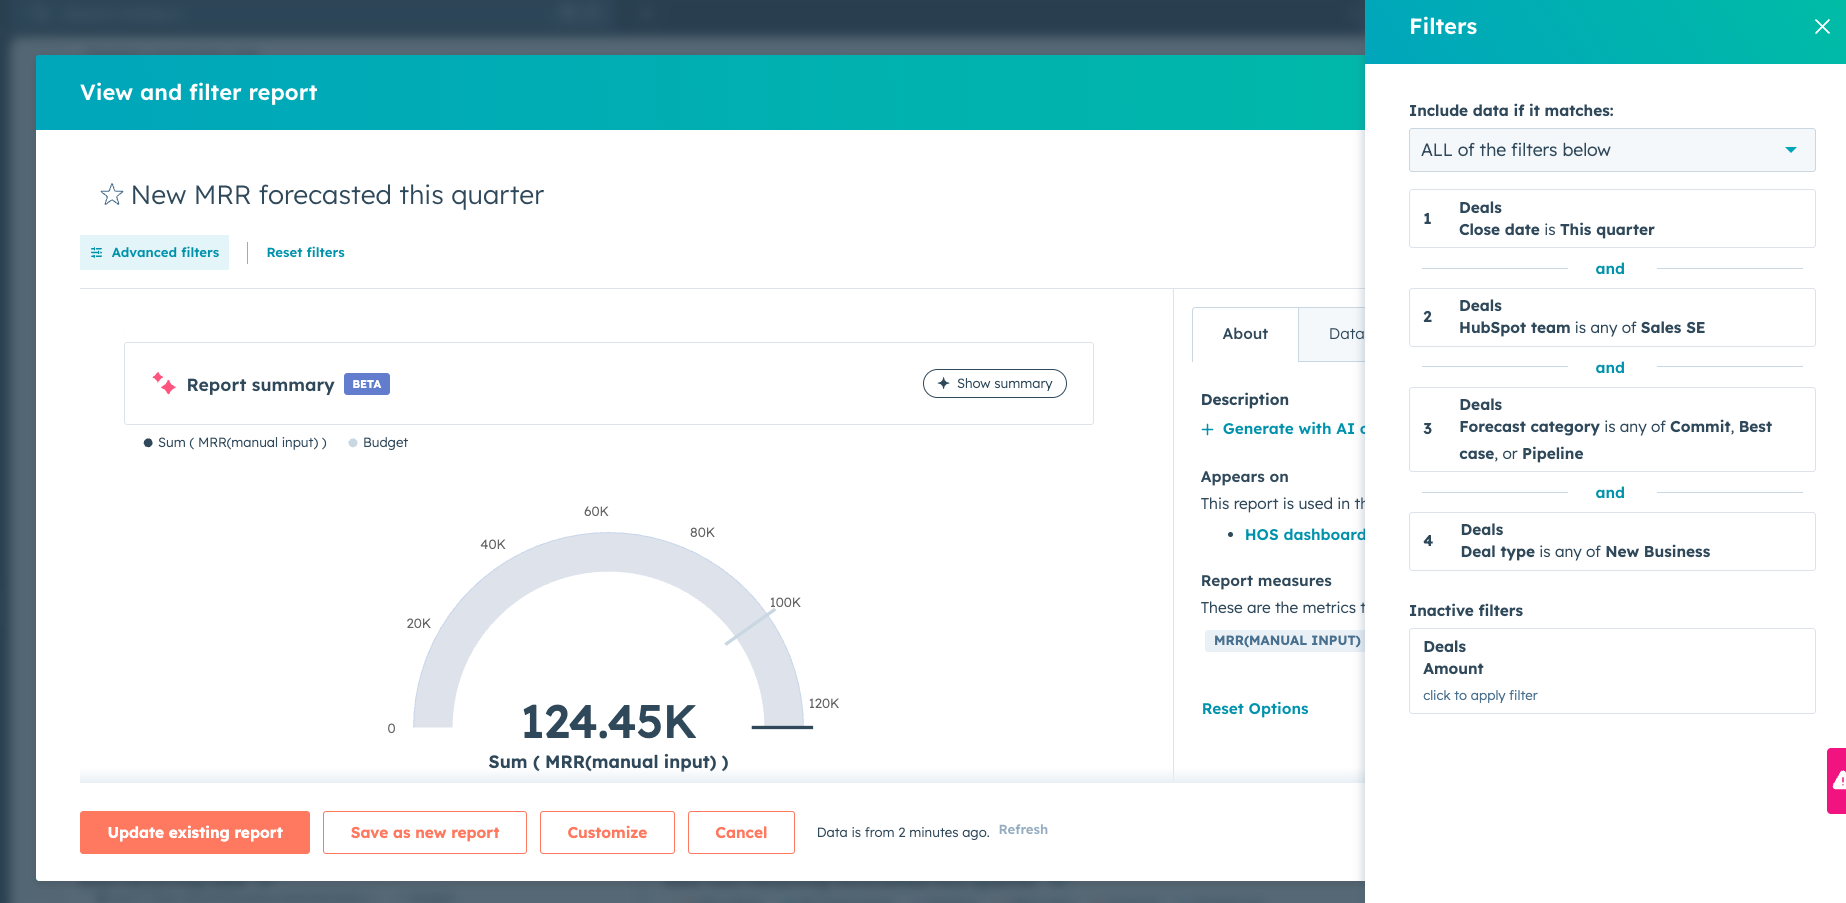
.png?width=670&height=328&name=image%20(14).png)
You can add budget to these reports by clicking "customize" and then you see this
Here you click "chart settings"
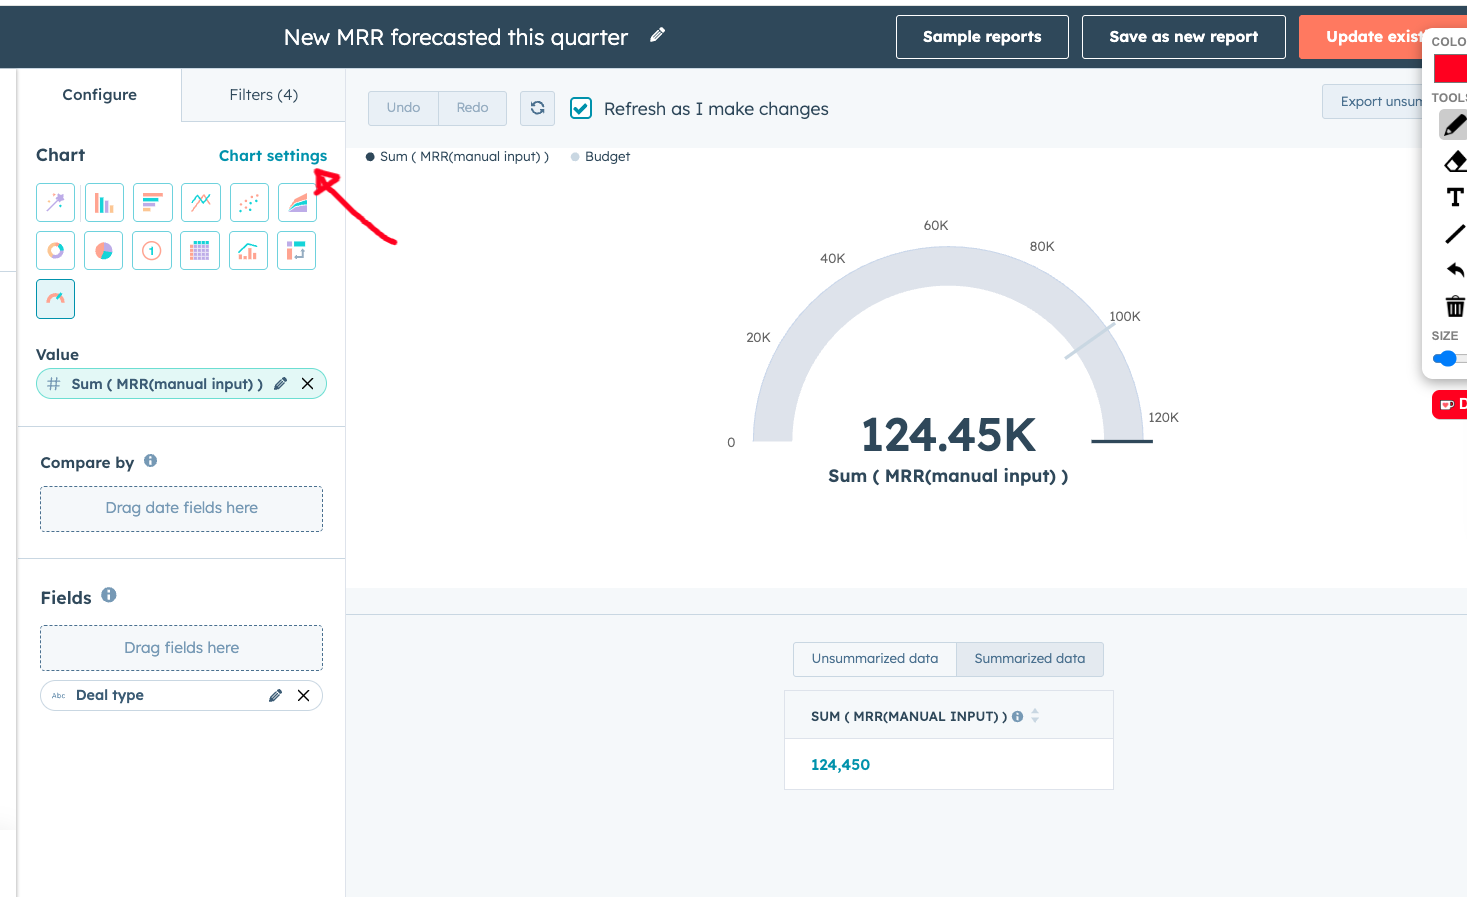
Here you can add a reference line and a value
.png?width=670&height=411&name=image%20(15).png)
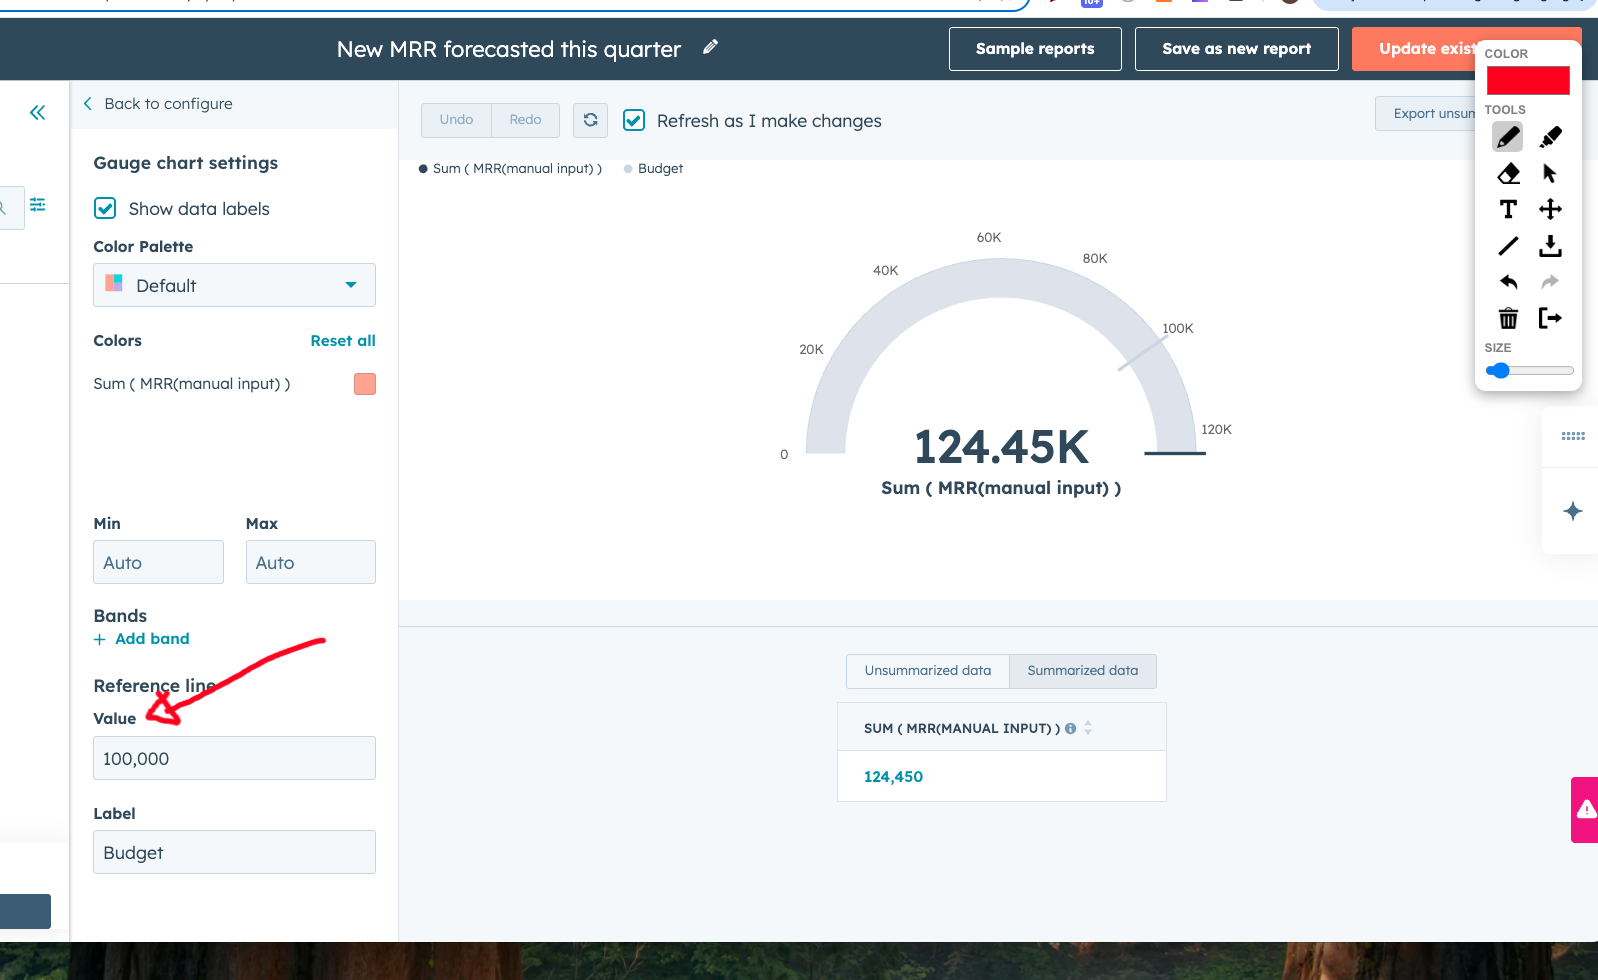
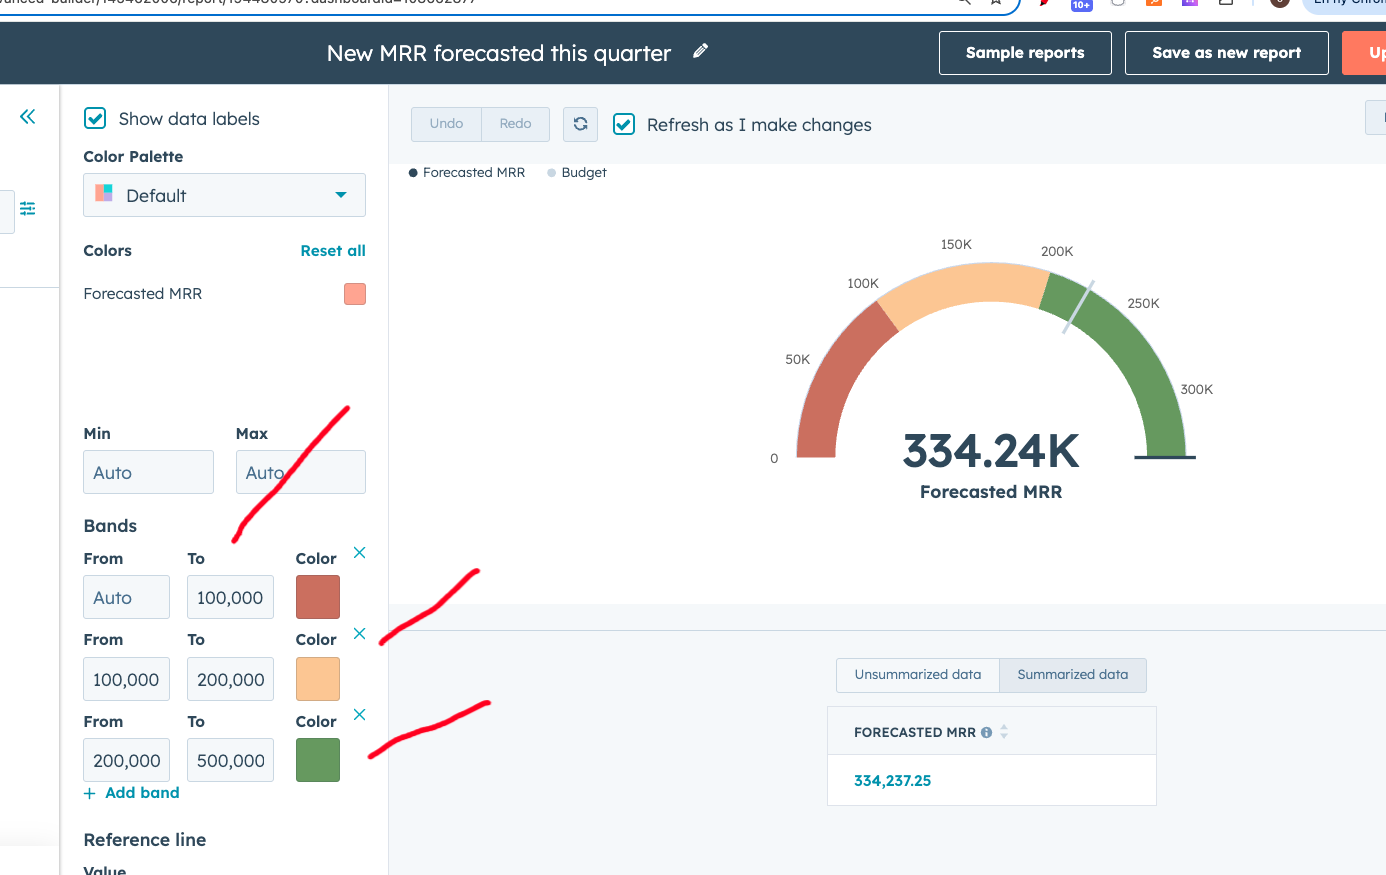
You can also add "bands" to the report which can show if you are on or off track from your goal.
See example from NO report
.png?width=670&height=423&name=image%20(16).png)
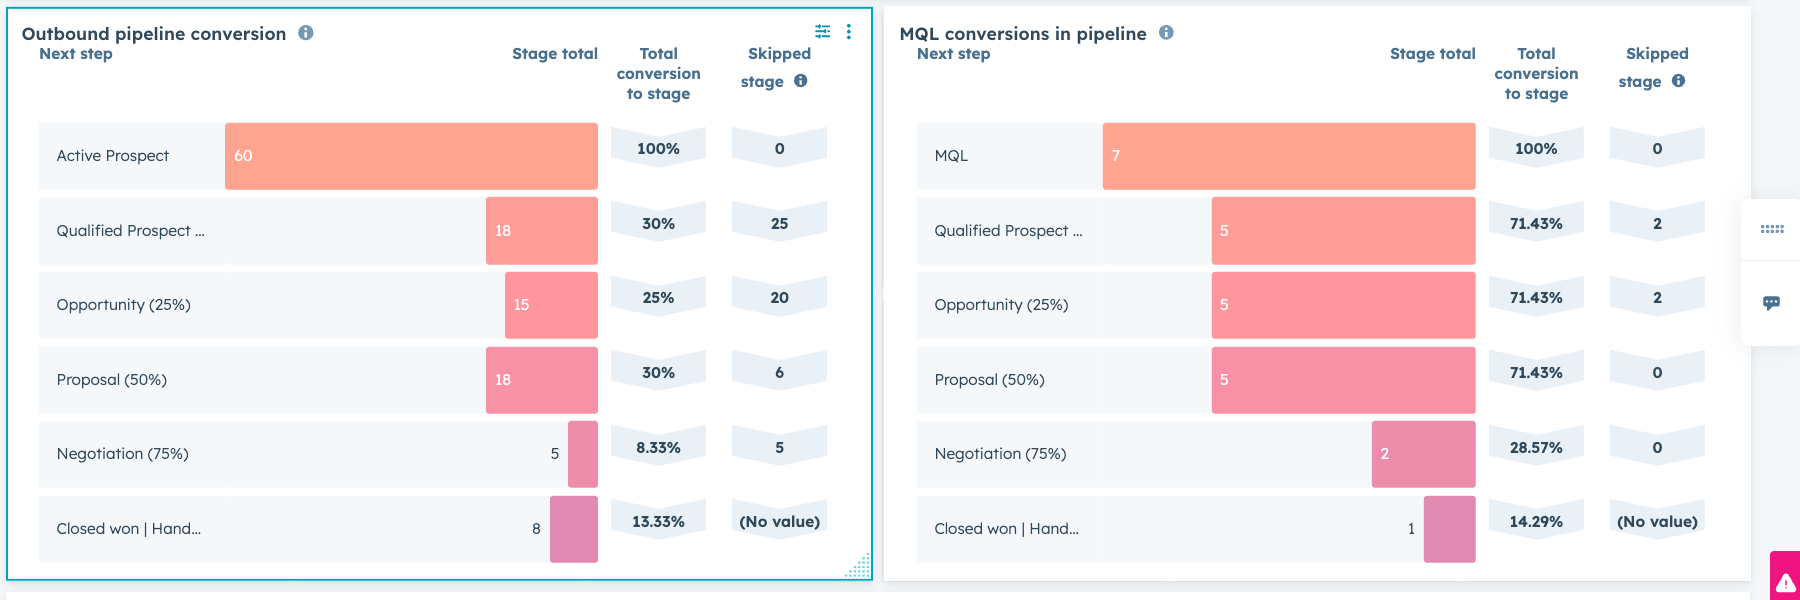
Conversion reports - why is there two?
The main reason is to measure how well inbound vs outbound converst
.png?width=670&height=223&name=image%20(17).png)
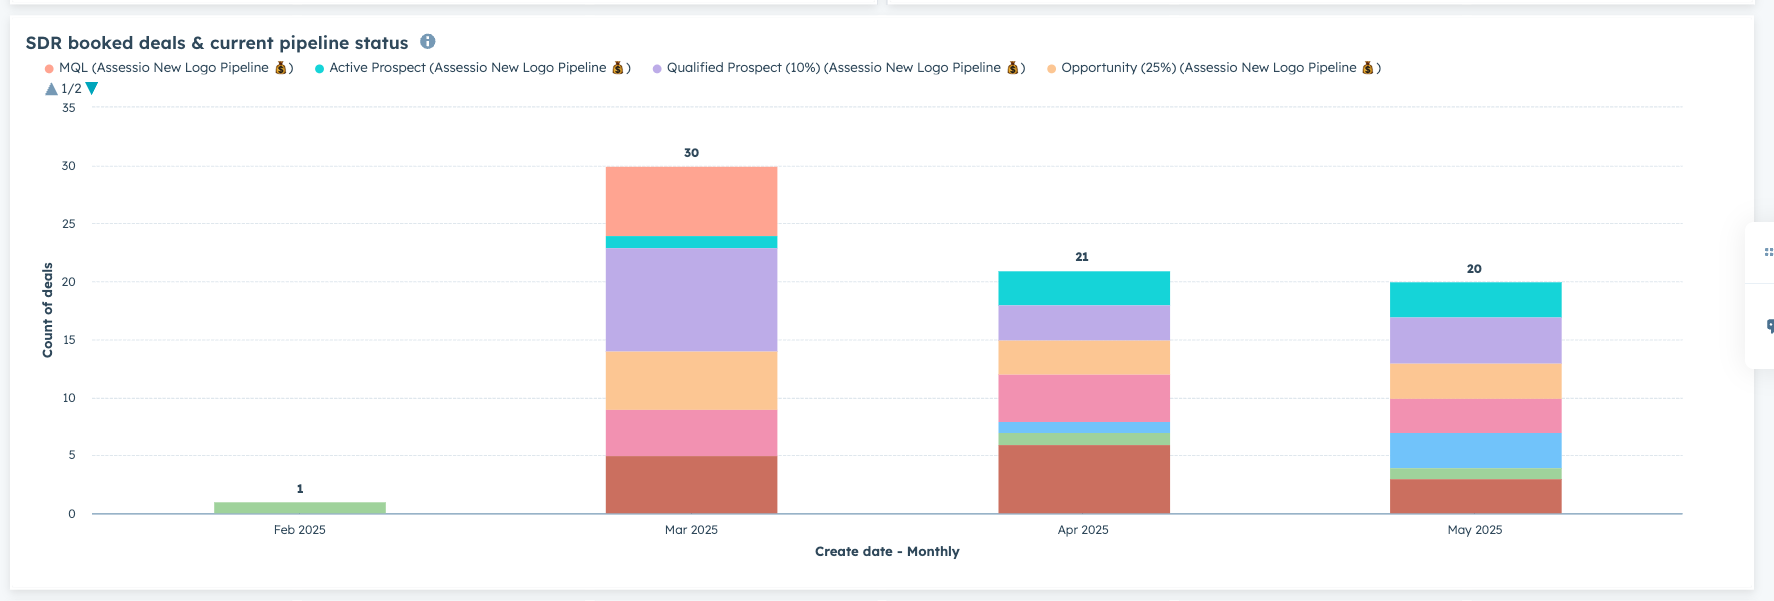
3. SDR report
This report is only on Sweden dashboard currently, as there is two SDR booking meetings and we want to follow the stages those meeting are in the pipeline now.
The report can easily be cloned and put on other dashboards
.png?width=670&height=227&name=image%20(18).png)
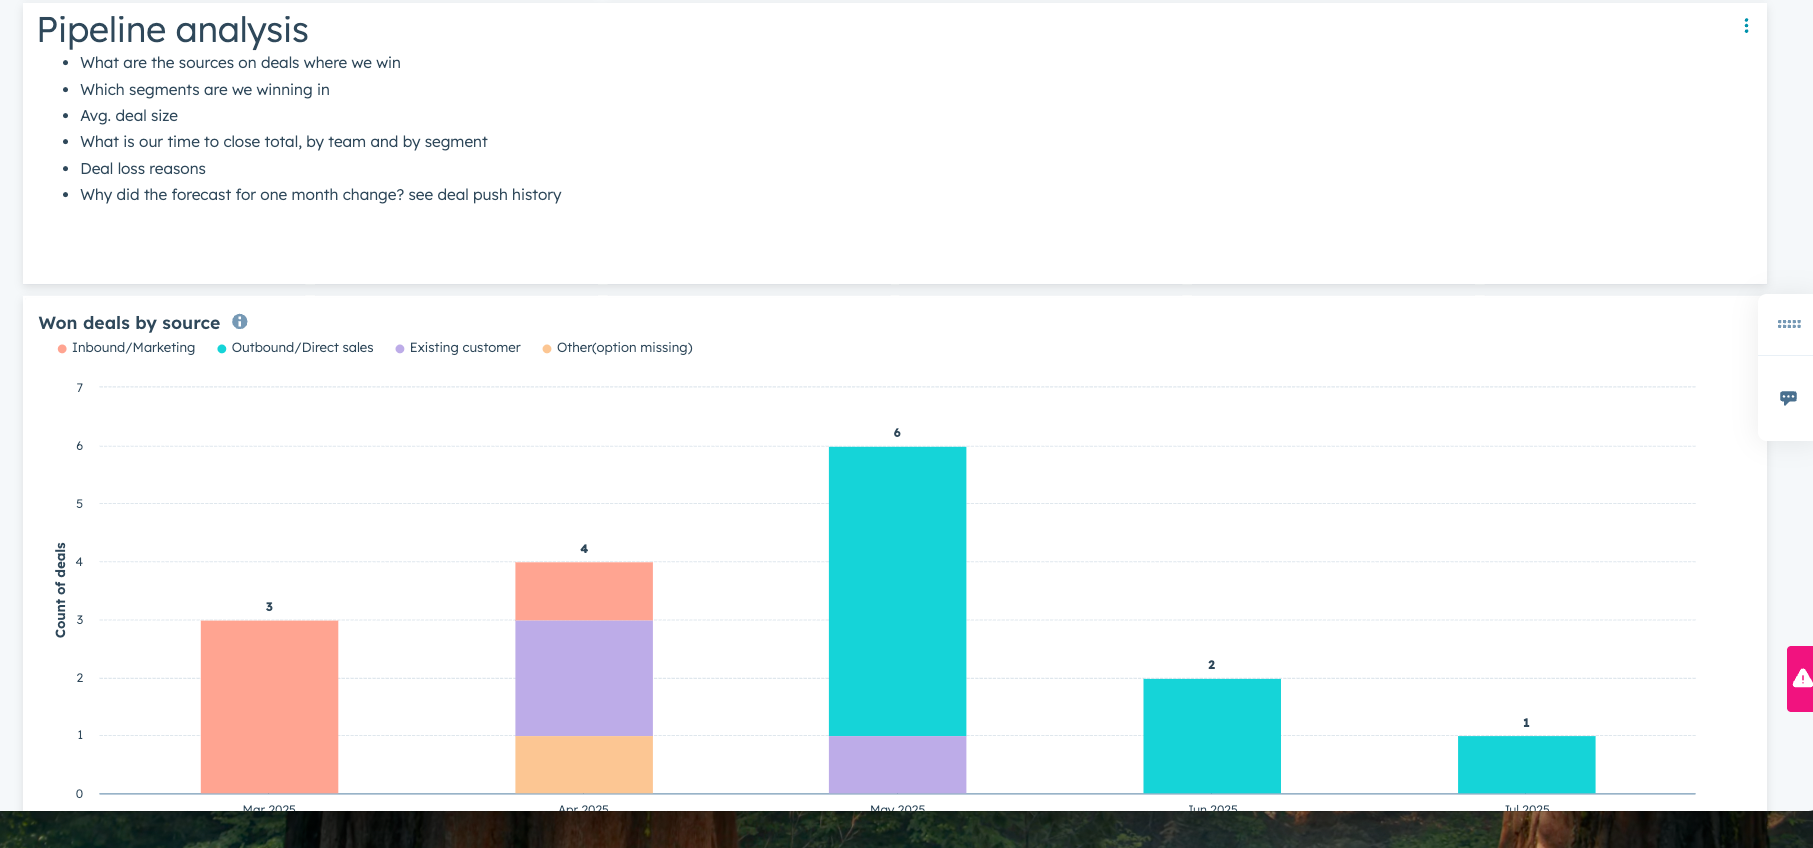
The pipeline analysis section is meant for drilldowns into the health of the pipeline
It is found in the bottom of dashboard, and will make sense to look at on a monthly basis
Marketing dashboards
-
Day to day marketing ops
-
Head of marketing
-
Day to day marketing ops -
HubspotReports dashboard
The purpose of this dashboard was to provide quick daily insight into current marketing efforts being run and to collaborate with sales on leads comming from marketing
-
Head of marketing -
Purpose here is to give each country head of marketing their own overview, to see all activitres, how many leads is comming in, their lifecycle stages and how much turns into pipeline and won offers
There is one for each country
The report contains
-
Total number of leads
-
New leads and Marketing qualified leads
-
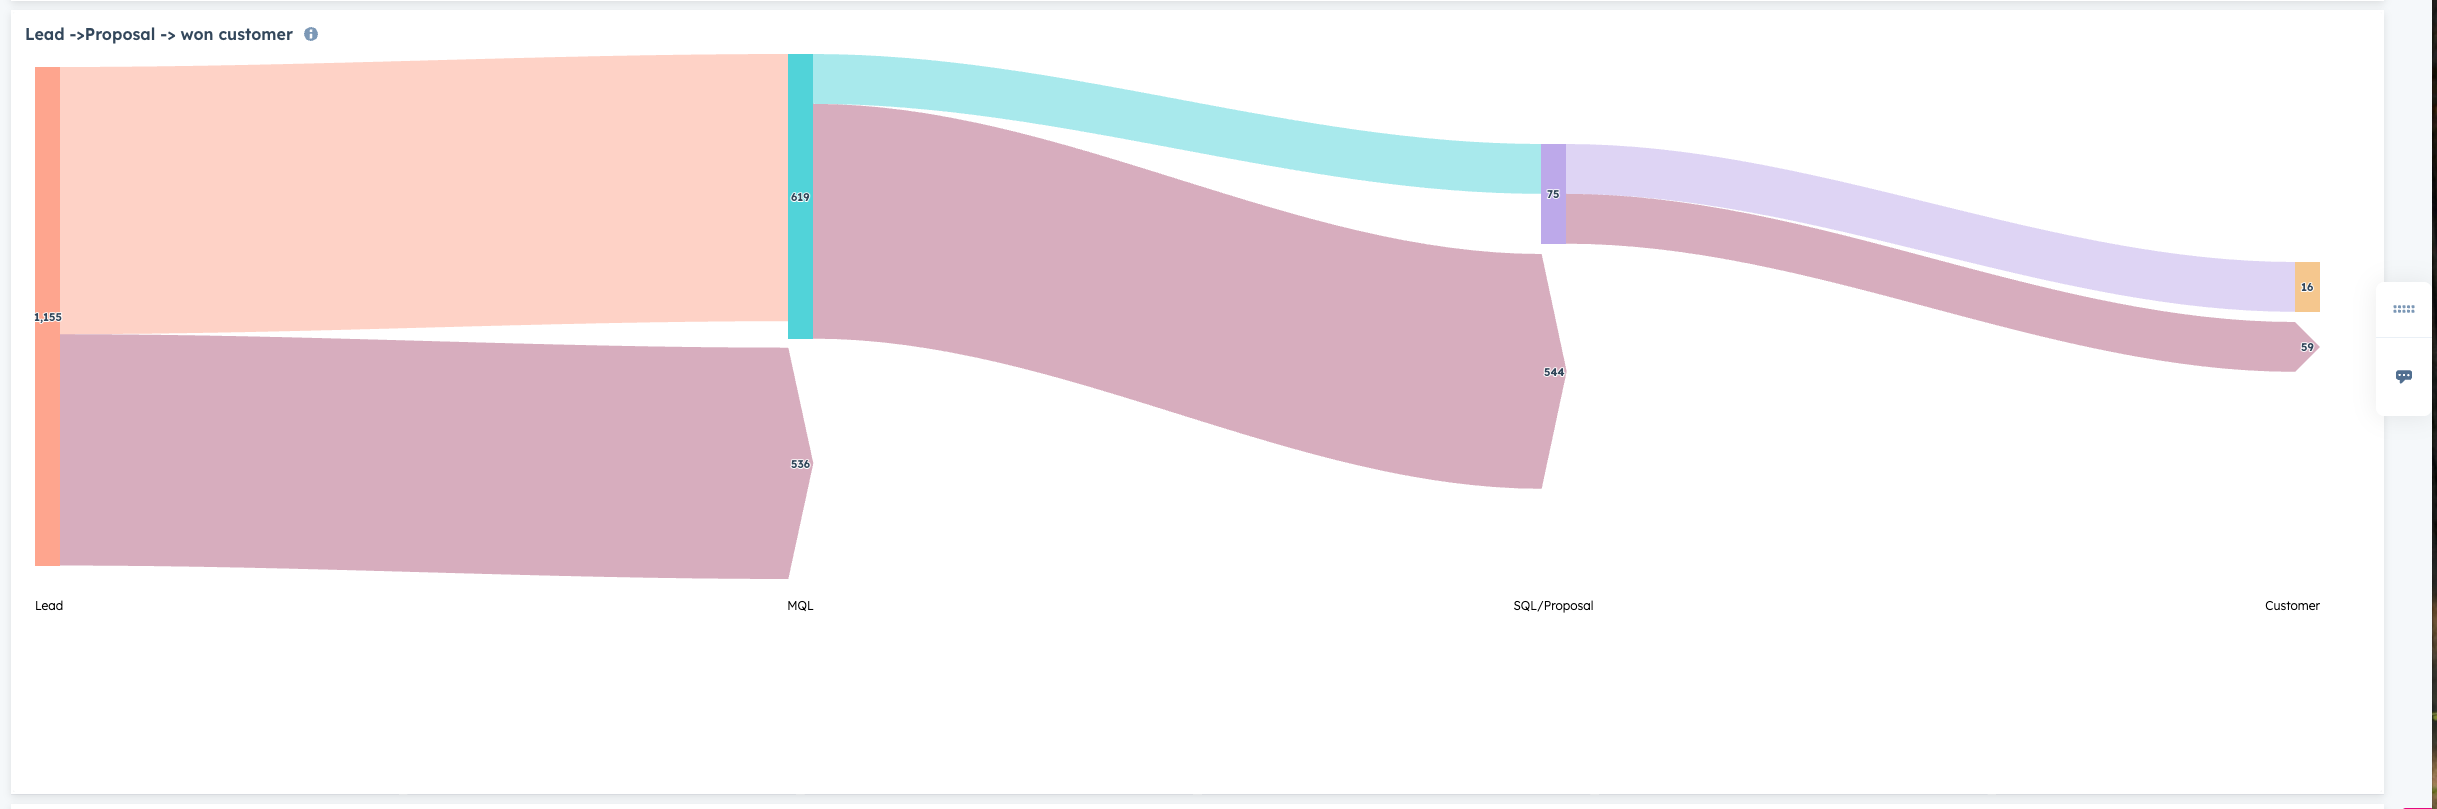
Conversions from Lead -> MQL -> SQL
-
By campaign/source/industry/segment
-
Campaign performance - what is good what needs checking - x axis campaign name y er deal stadie
-
Lead status in pipeline – qualified/opportunity – where is it sitting currently
-
Forecasted MRR from marketing + source + campaigns
-
Closed MRR from marketing + source + campaigns
-
Won customer segments from marketing
-
Leads disqualified and reasons for it
This report will show you how many leads converted into MQL that turned into SQL and then how many of them became customers
.png?width=670&height=222&name=image%20(20).png)
This report is one of the most vital, as it shows how many customers are won form marketing sources. This is based on the deal source 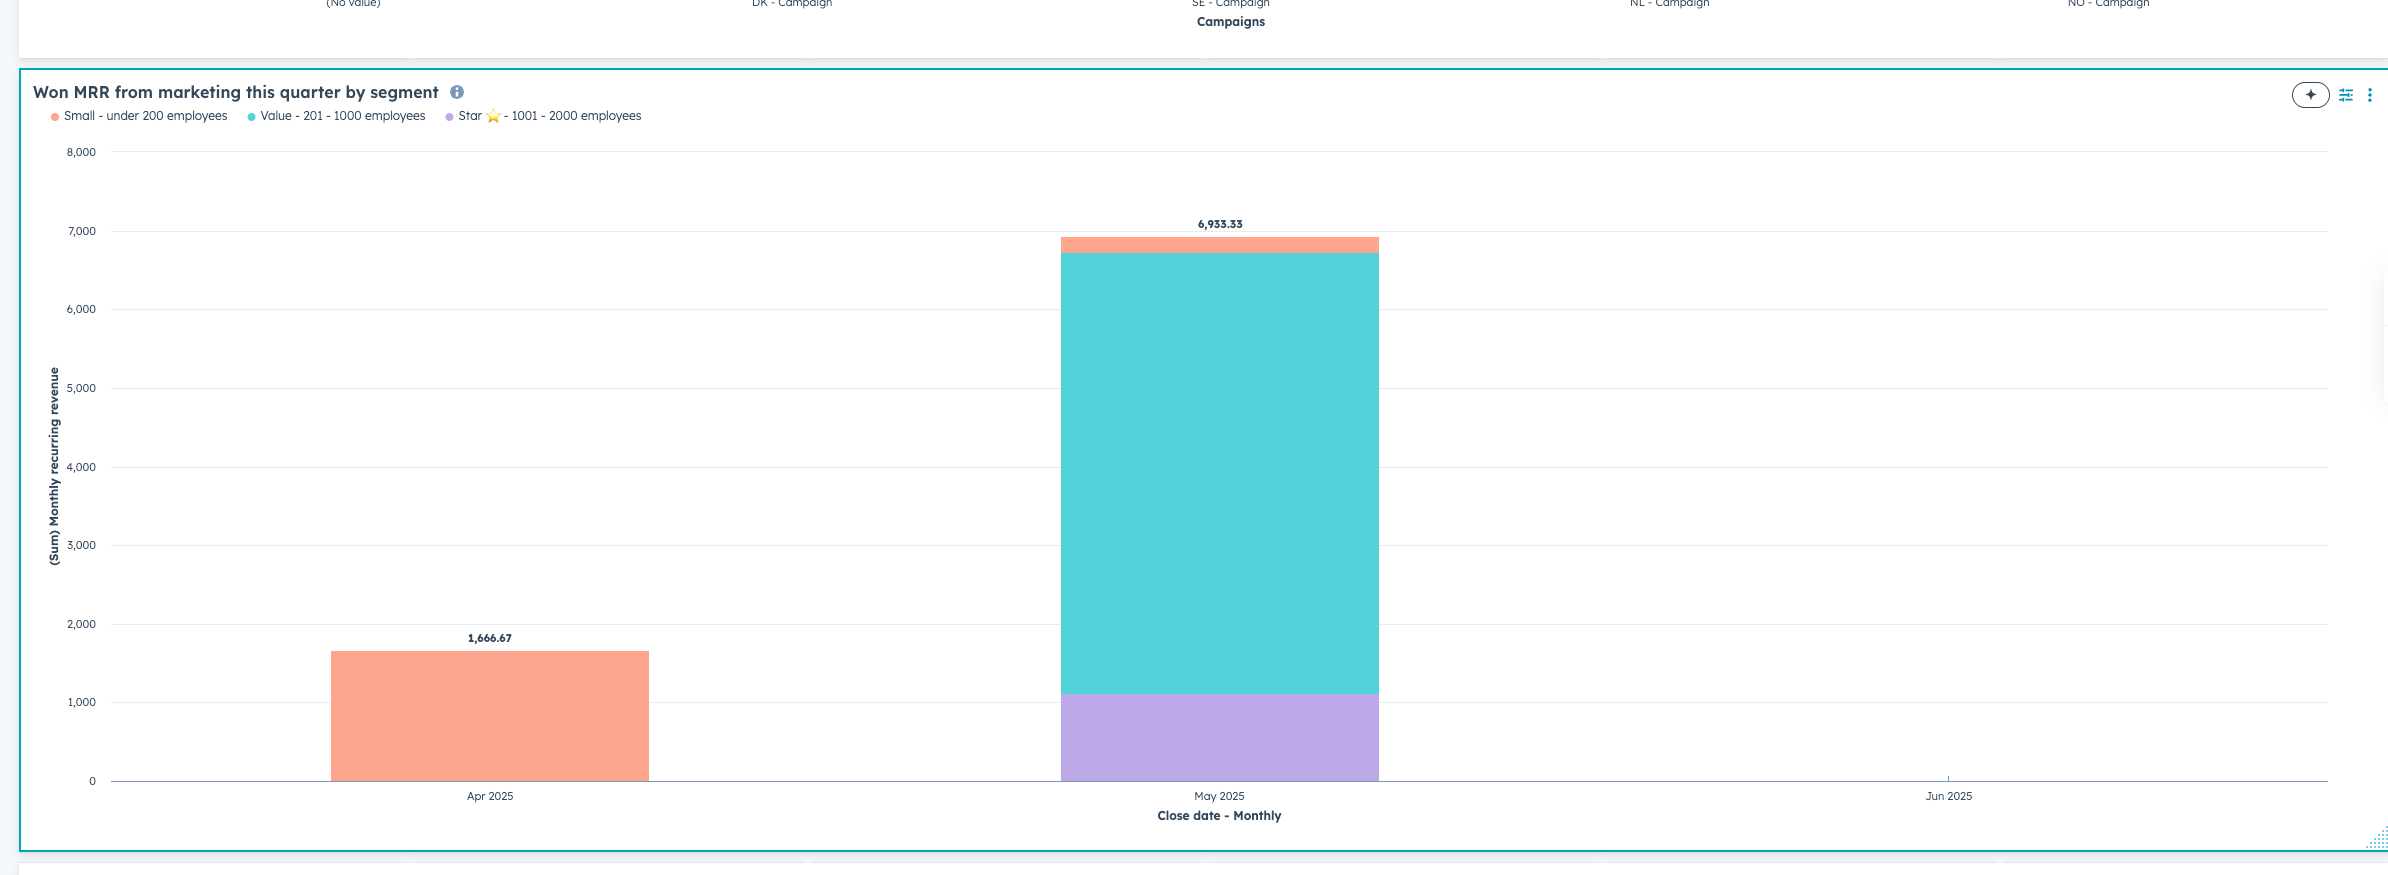
.png?width=670&height=245&name=image%20(21).png)
Support dashboards
-
Support template
Simple dashboard giving an overview of tickets over time, totals per status, category and acvg. response time
CSM dashboards
-
CSM dashboard
Management
-
MD dashboards
-
CRO dashboard
-
Territory planning
-
Adoption dashboard
-
MD dashboard
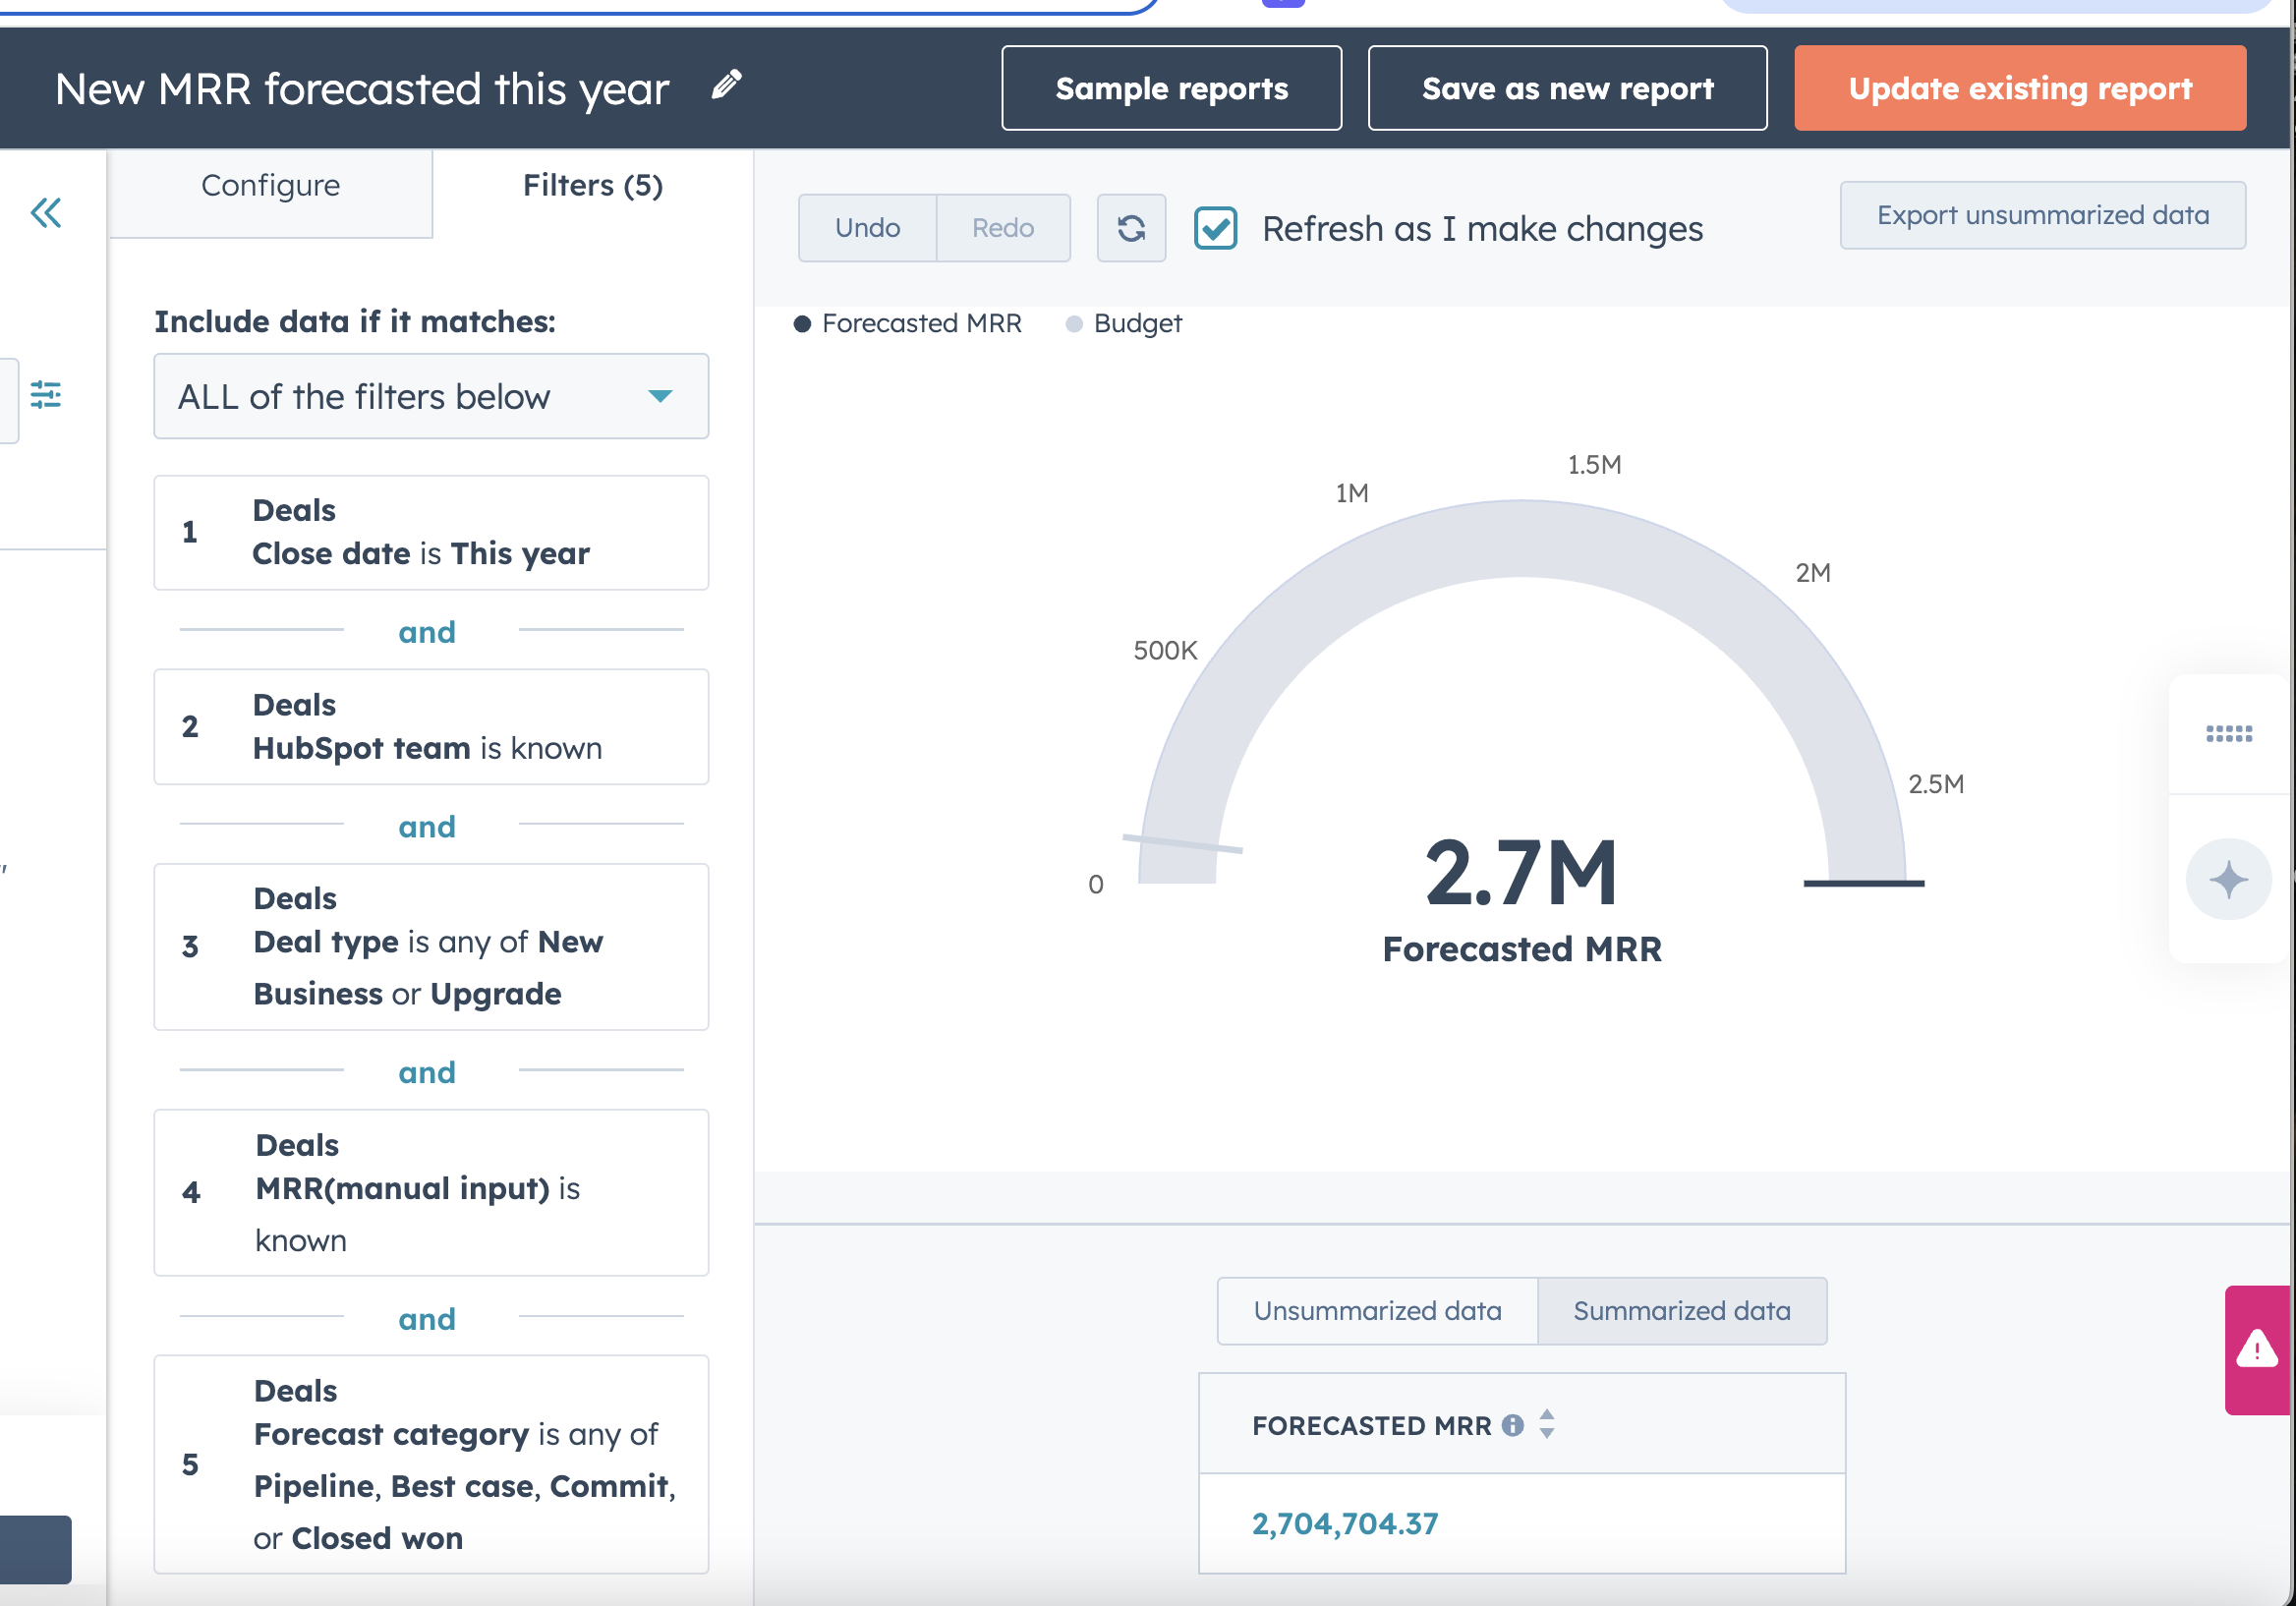
The reports goal is to give the MD a quick overview of the most important numbers and how their entity is going against budgets for MRR and non-recurring if that is measured for the country
New MRR forecast is seen as both new customers but also upgrades on existing
.png?width=670&height=469&name=image%20(22).png)
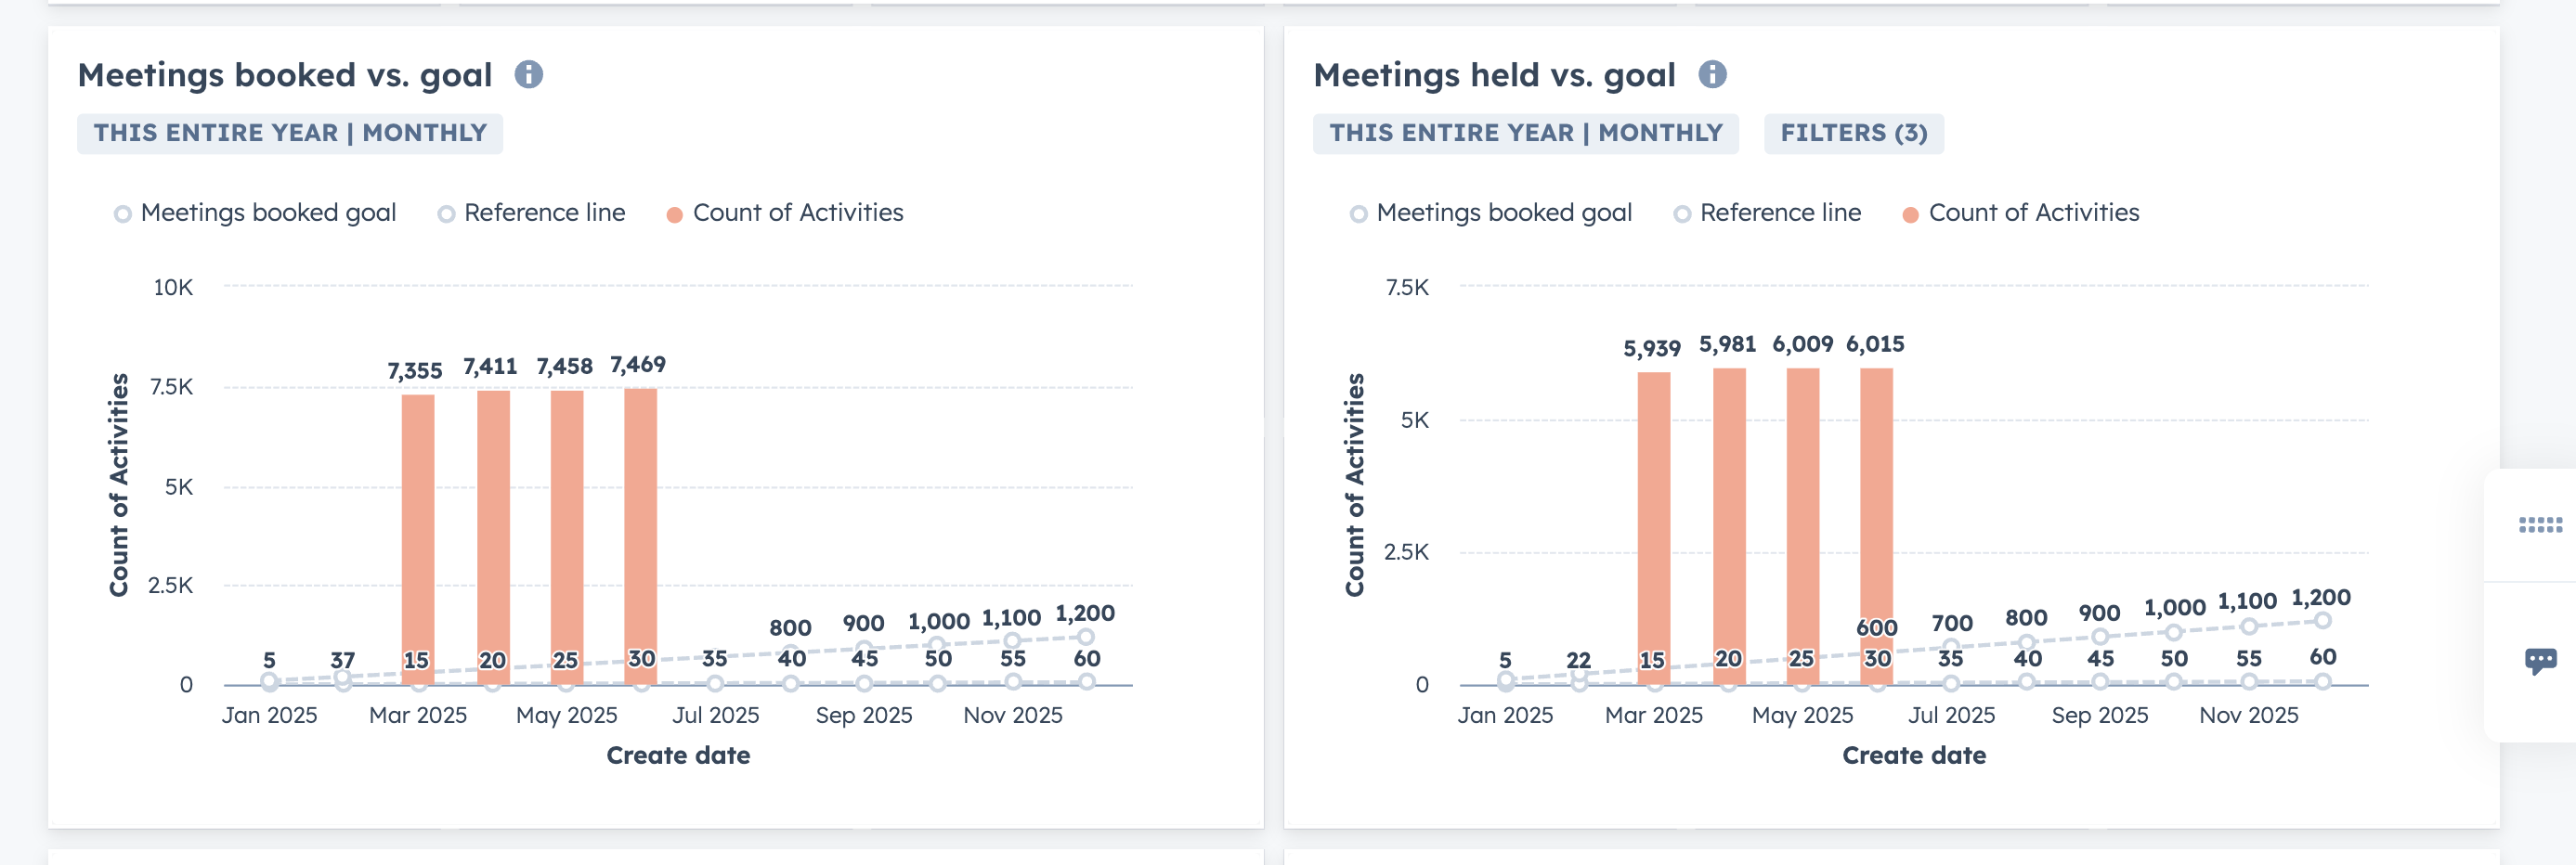
This report uses MRR uneweighted and looks at number of forecasted deals and MRR month over month
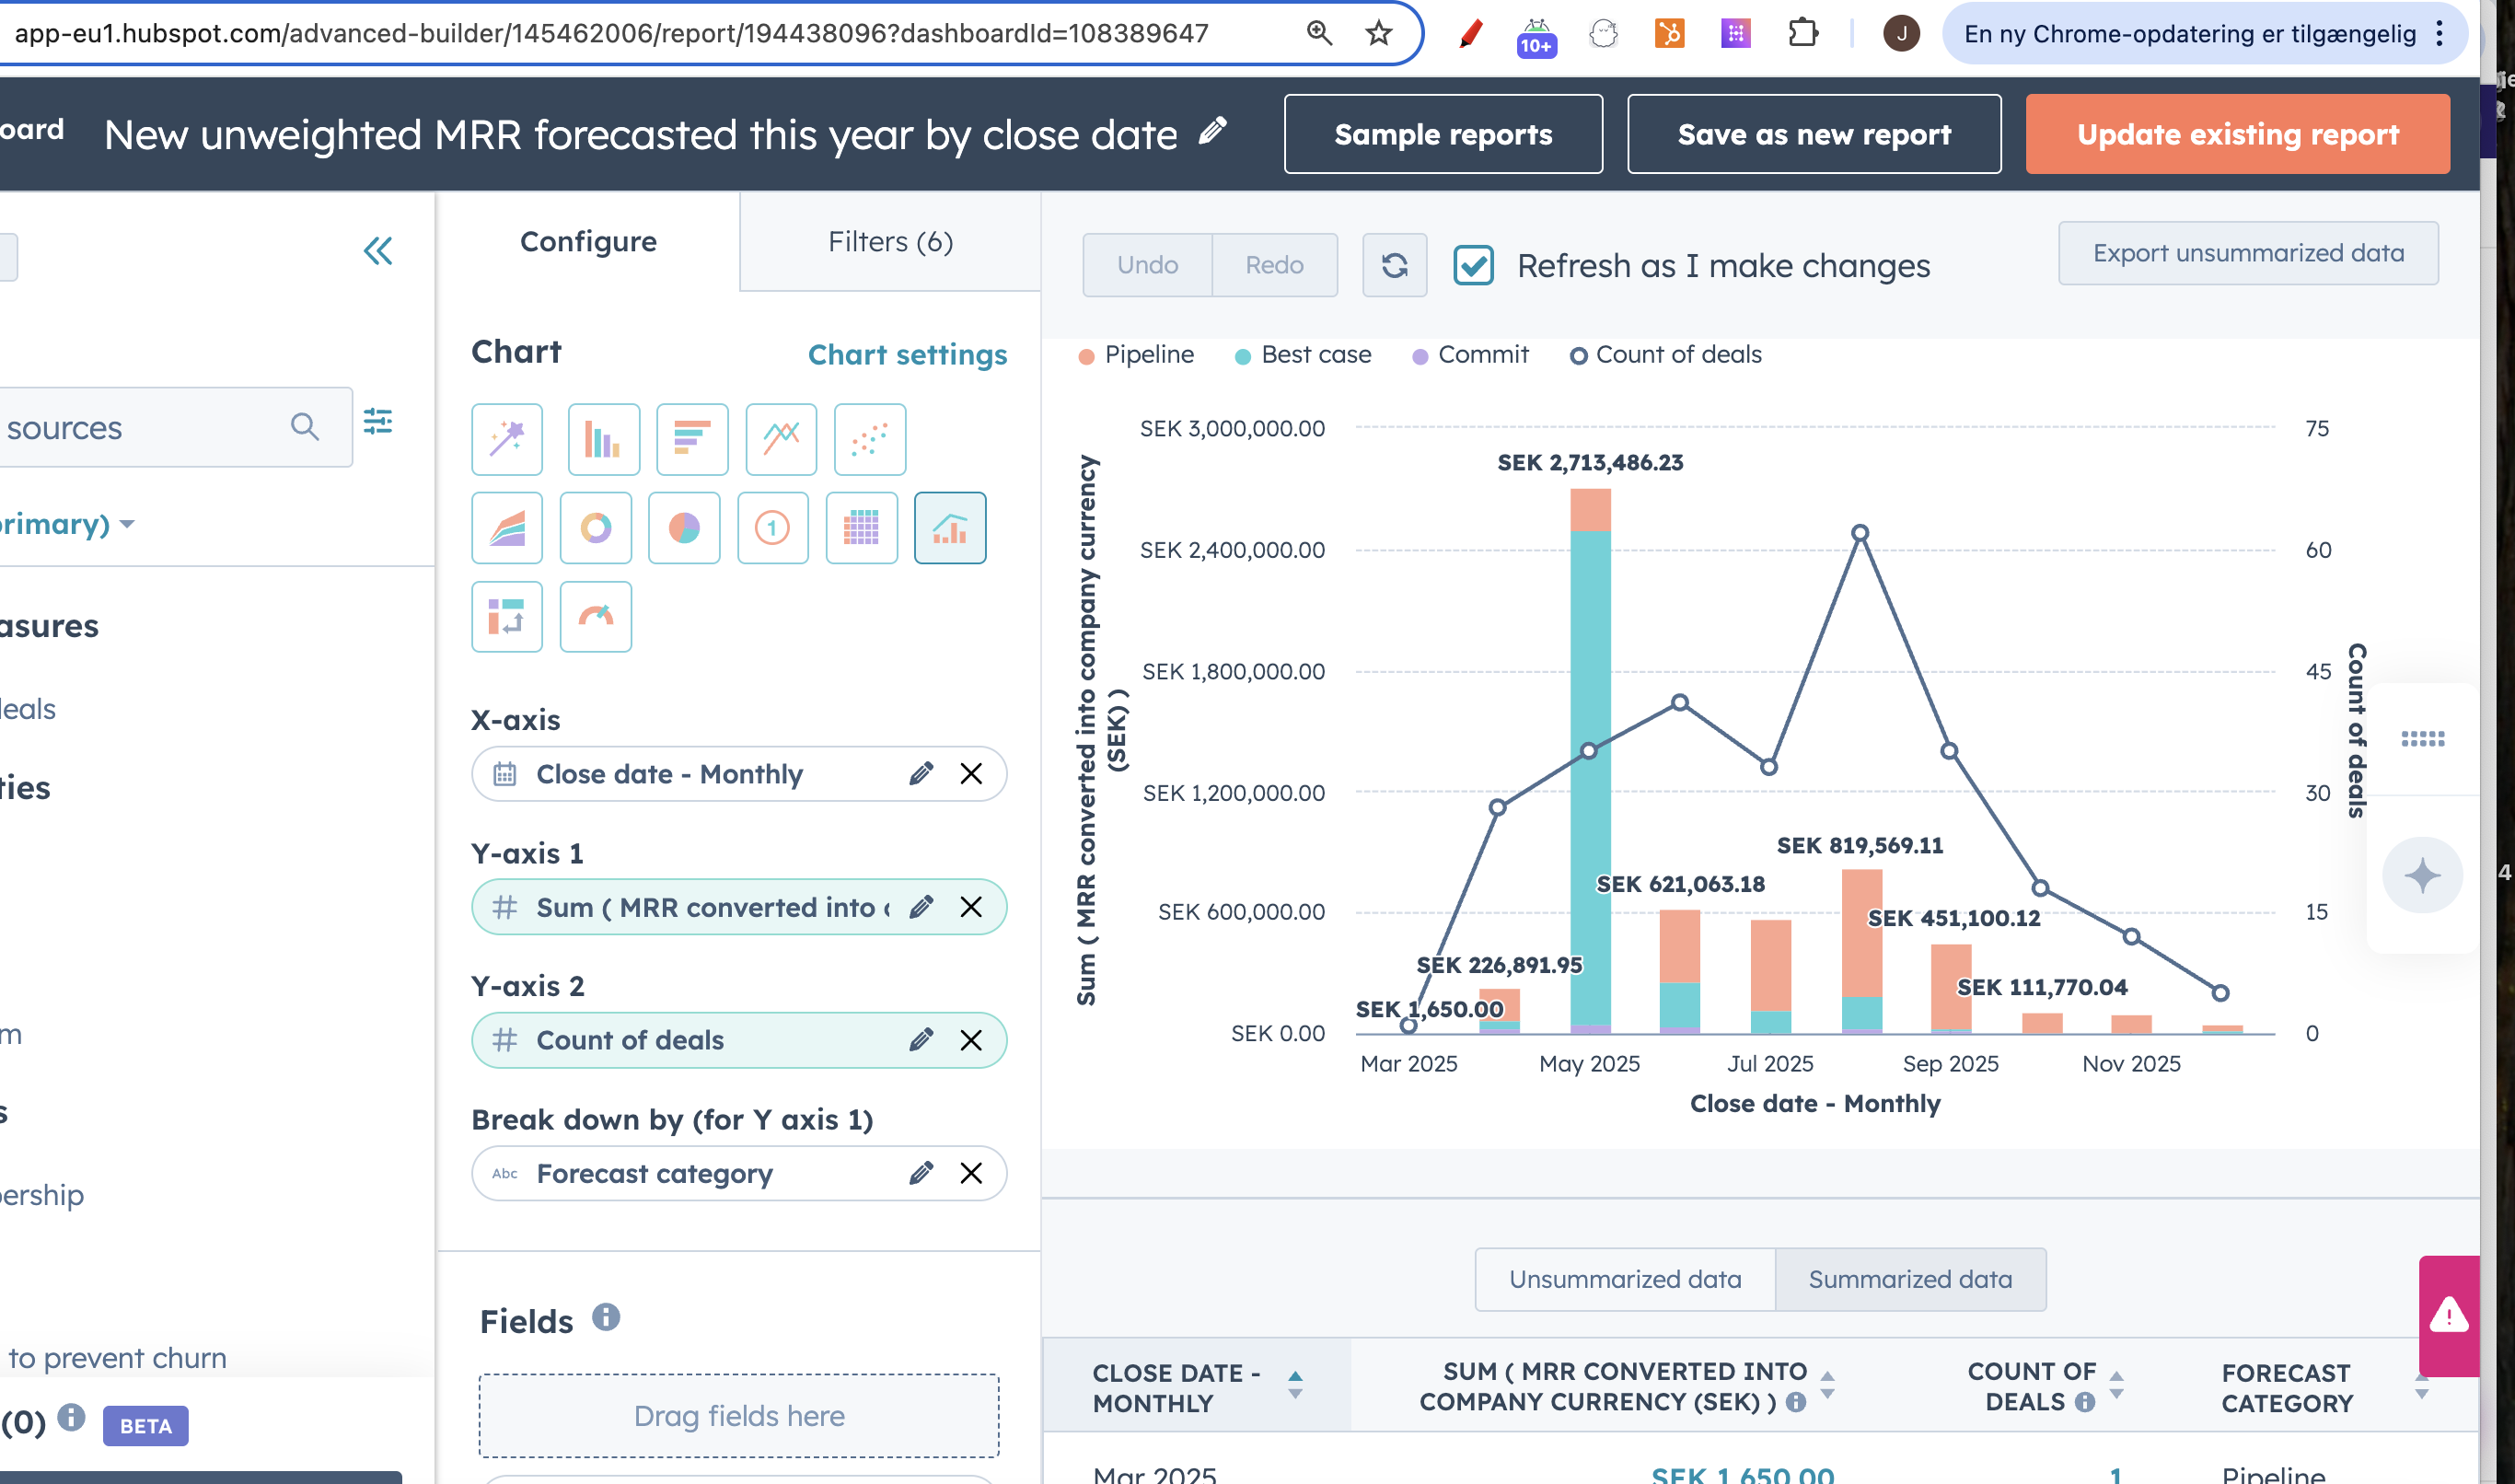
Custom goal reports for meetings booked and held can be changed by clicking on the report and then on the right scroll down to goals and insert static number
-1.png?width=670&height=225&name=image%20(24)-1.png)
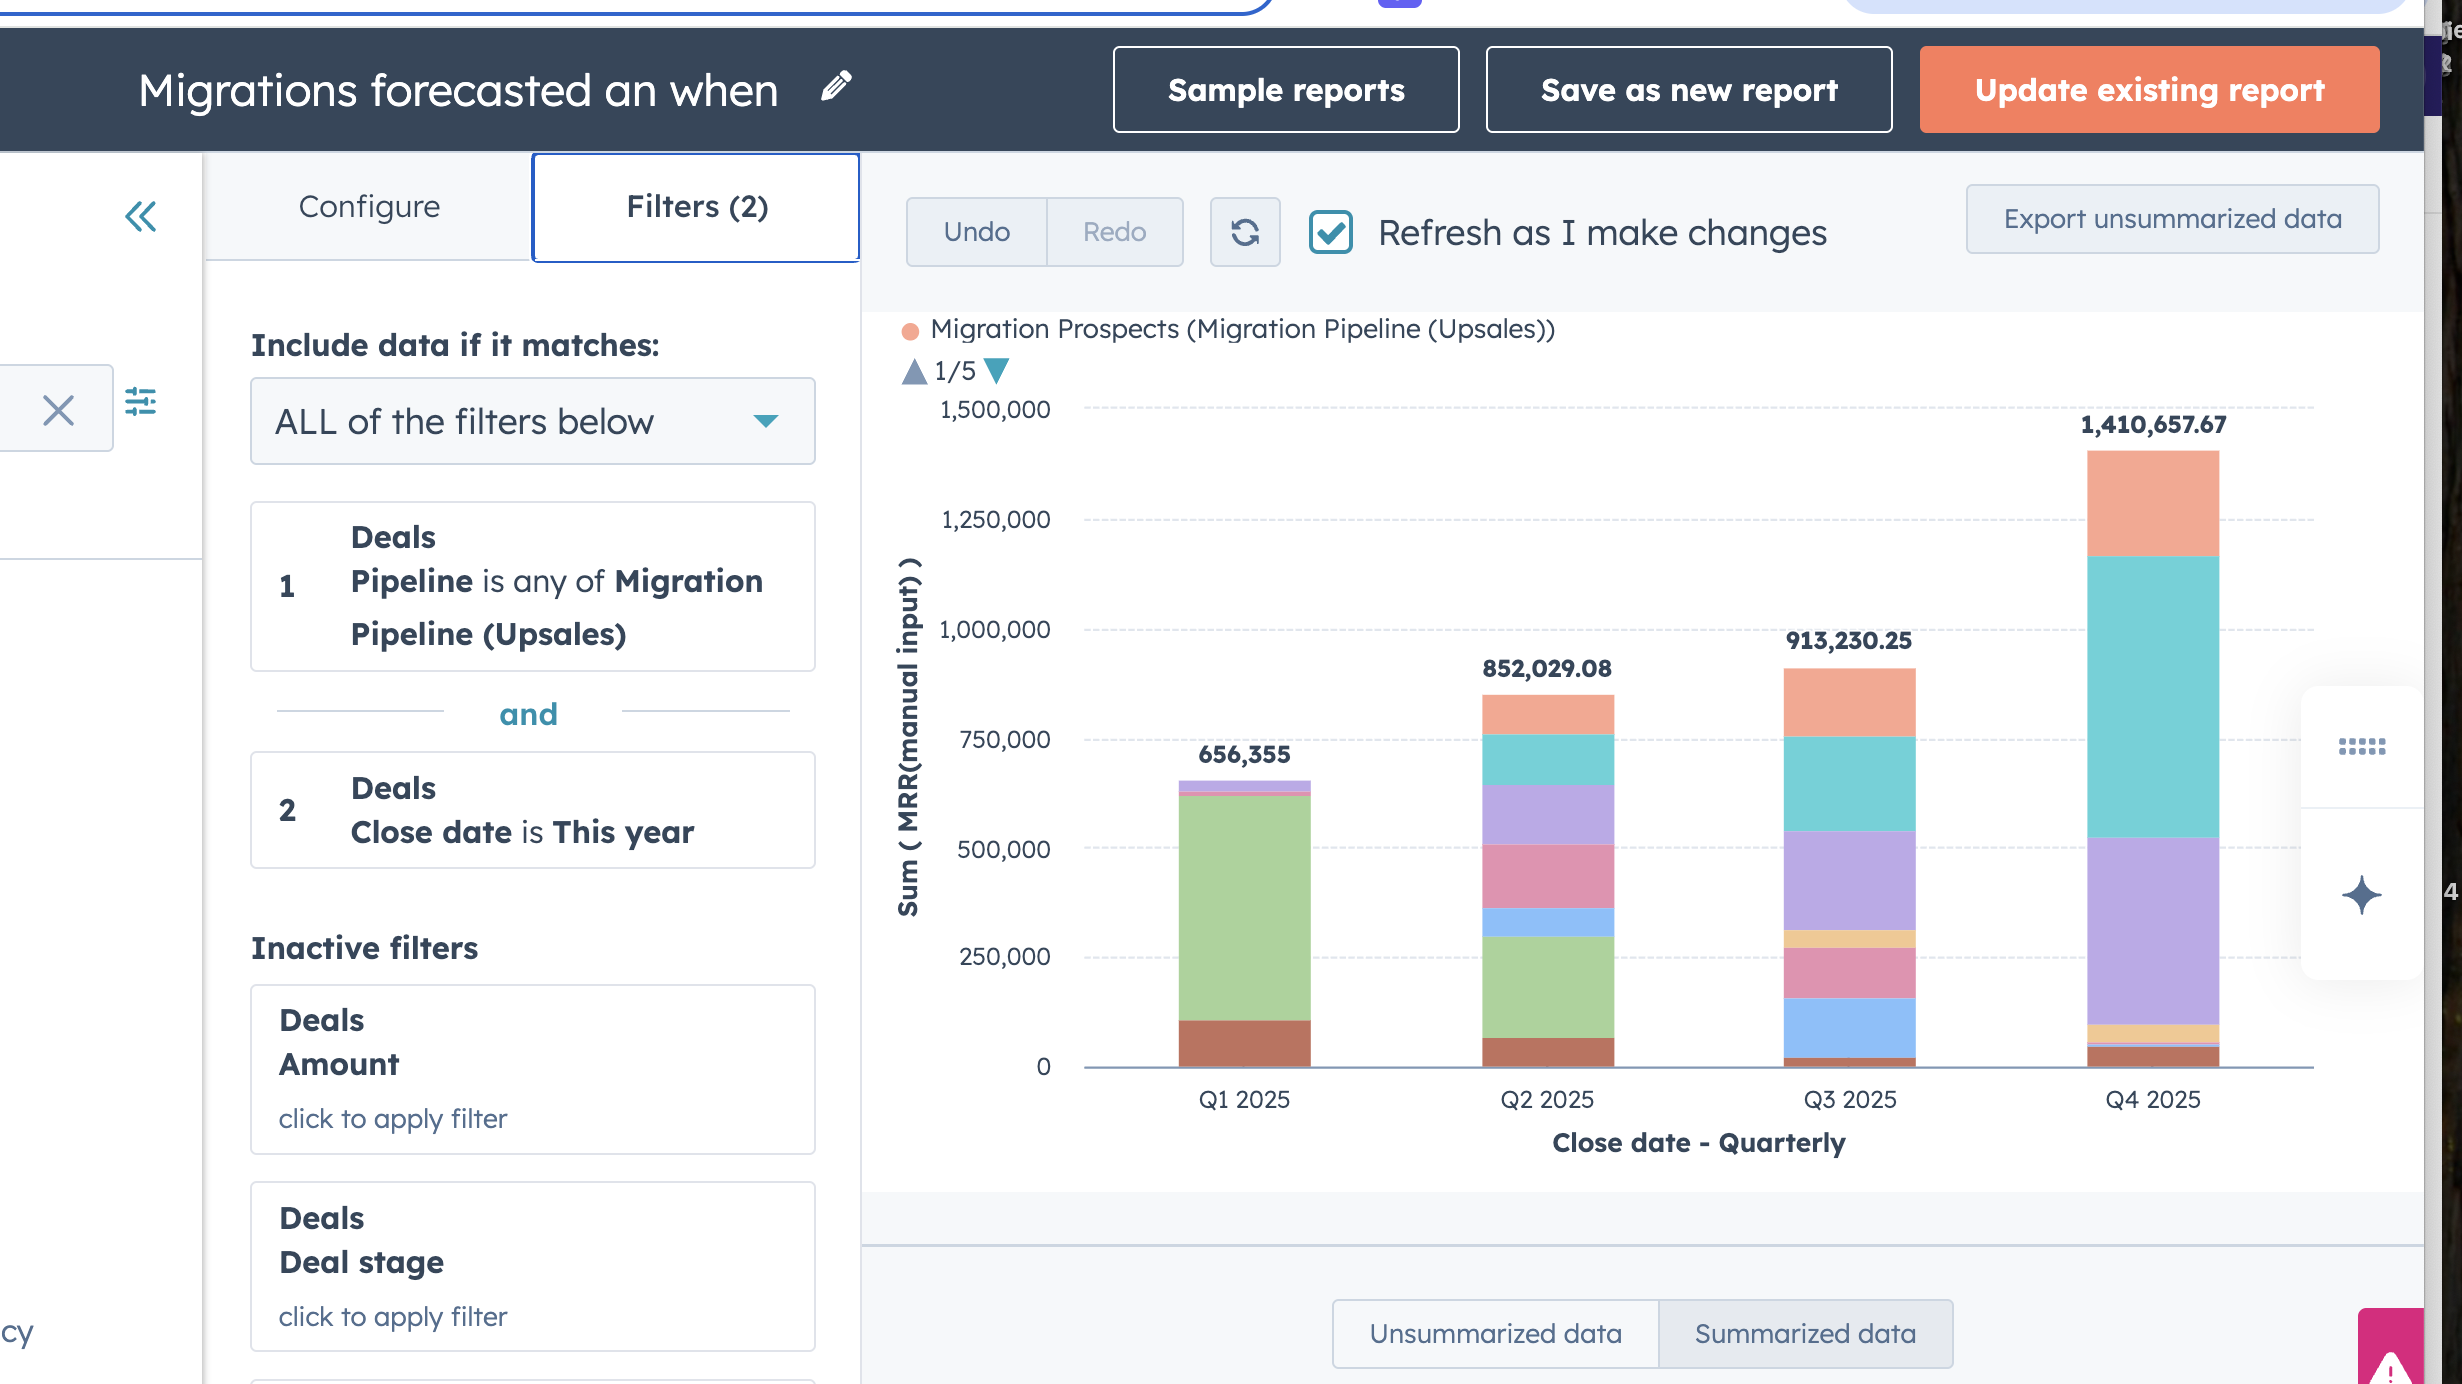
The migration report is focused on migration pipeline and going from legacy platfom to new platform. It shows the current pipeline, what is out and what is closed by quarter by deal stage.
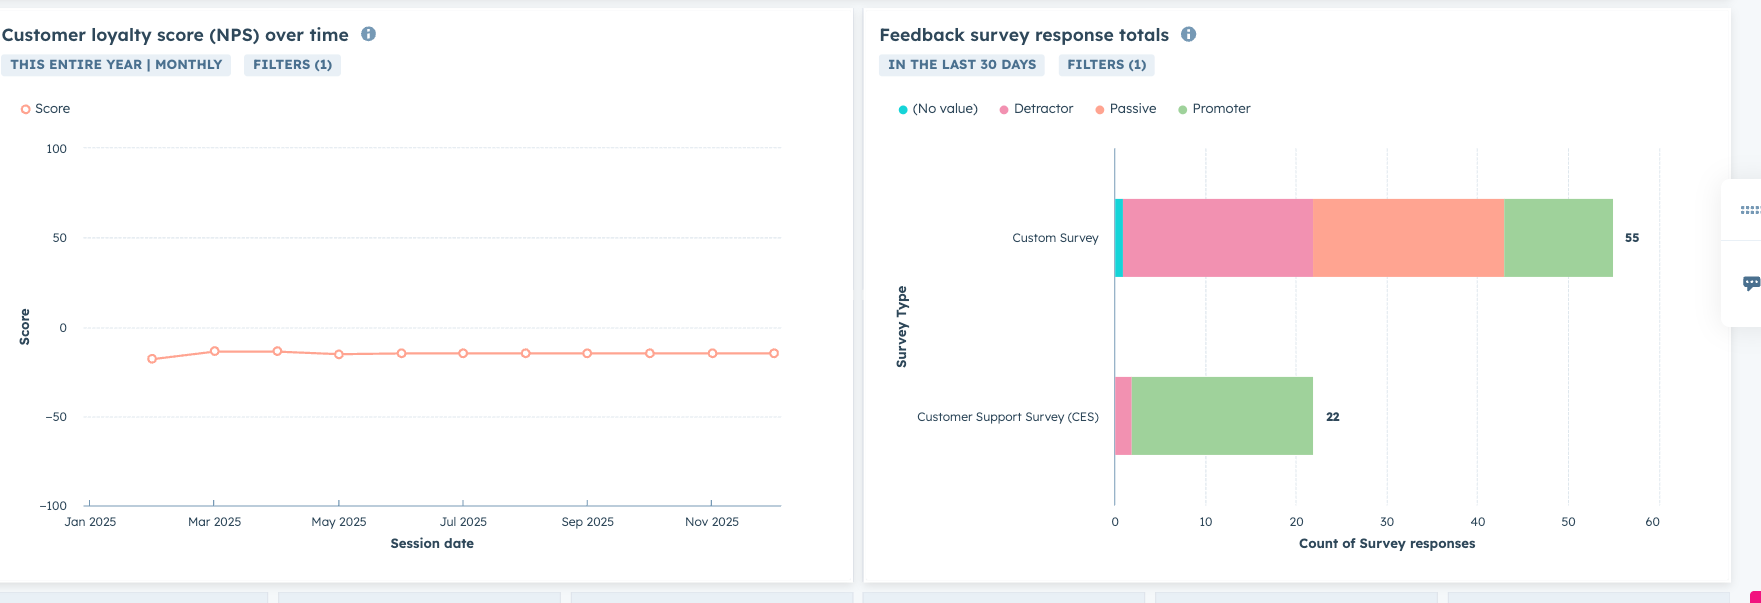
NPS
Feedback surveys/NPS are sent out recurringly and this gives an overview of the development in the score and the number of passive, detractors and promoters there is
.png?width=670&height=229&name=image%20(25).png)
CRO dashboard
Made as an overview of the business for Mikkel, main focus is in pipeline development over time for total contract values, MRR and seeing forecast both weighed and unweighted.
This per entity/country and also top 10 deals across all countries
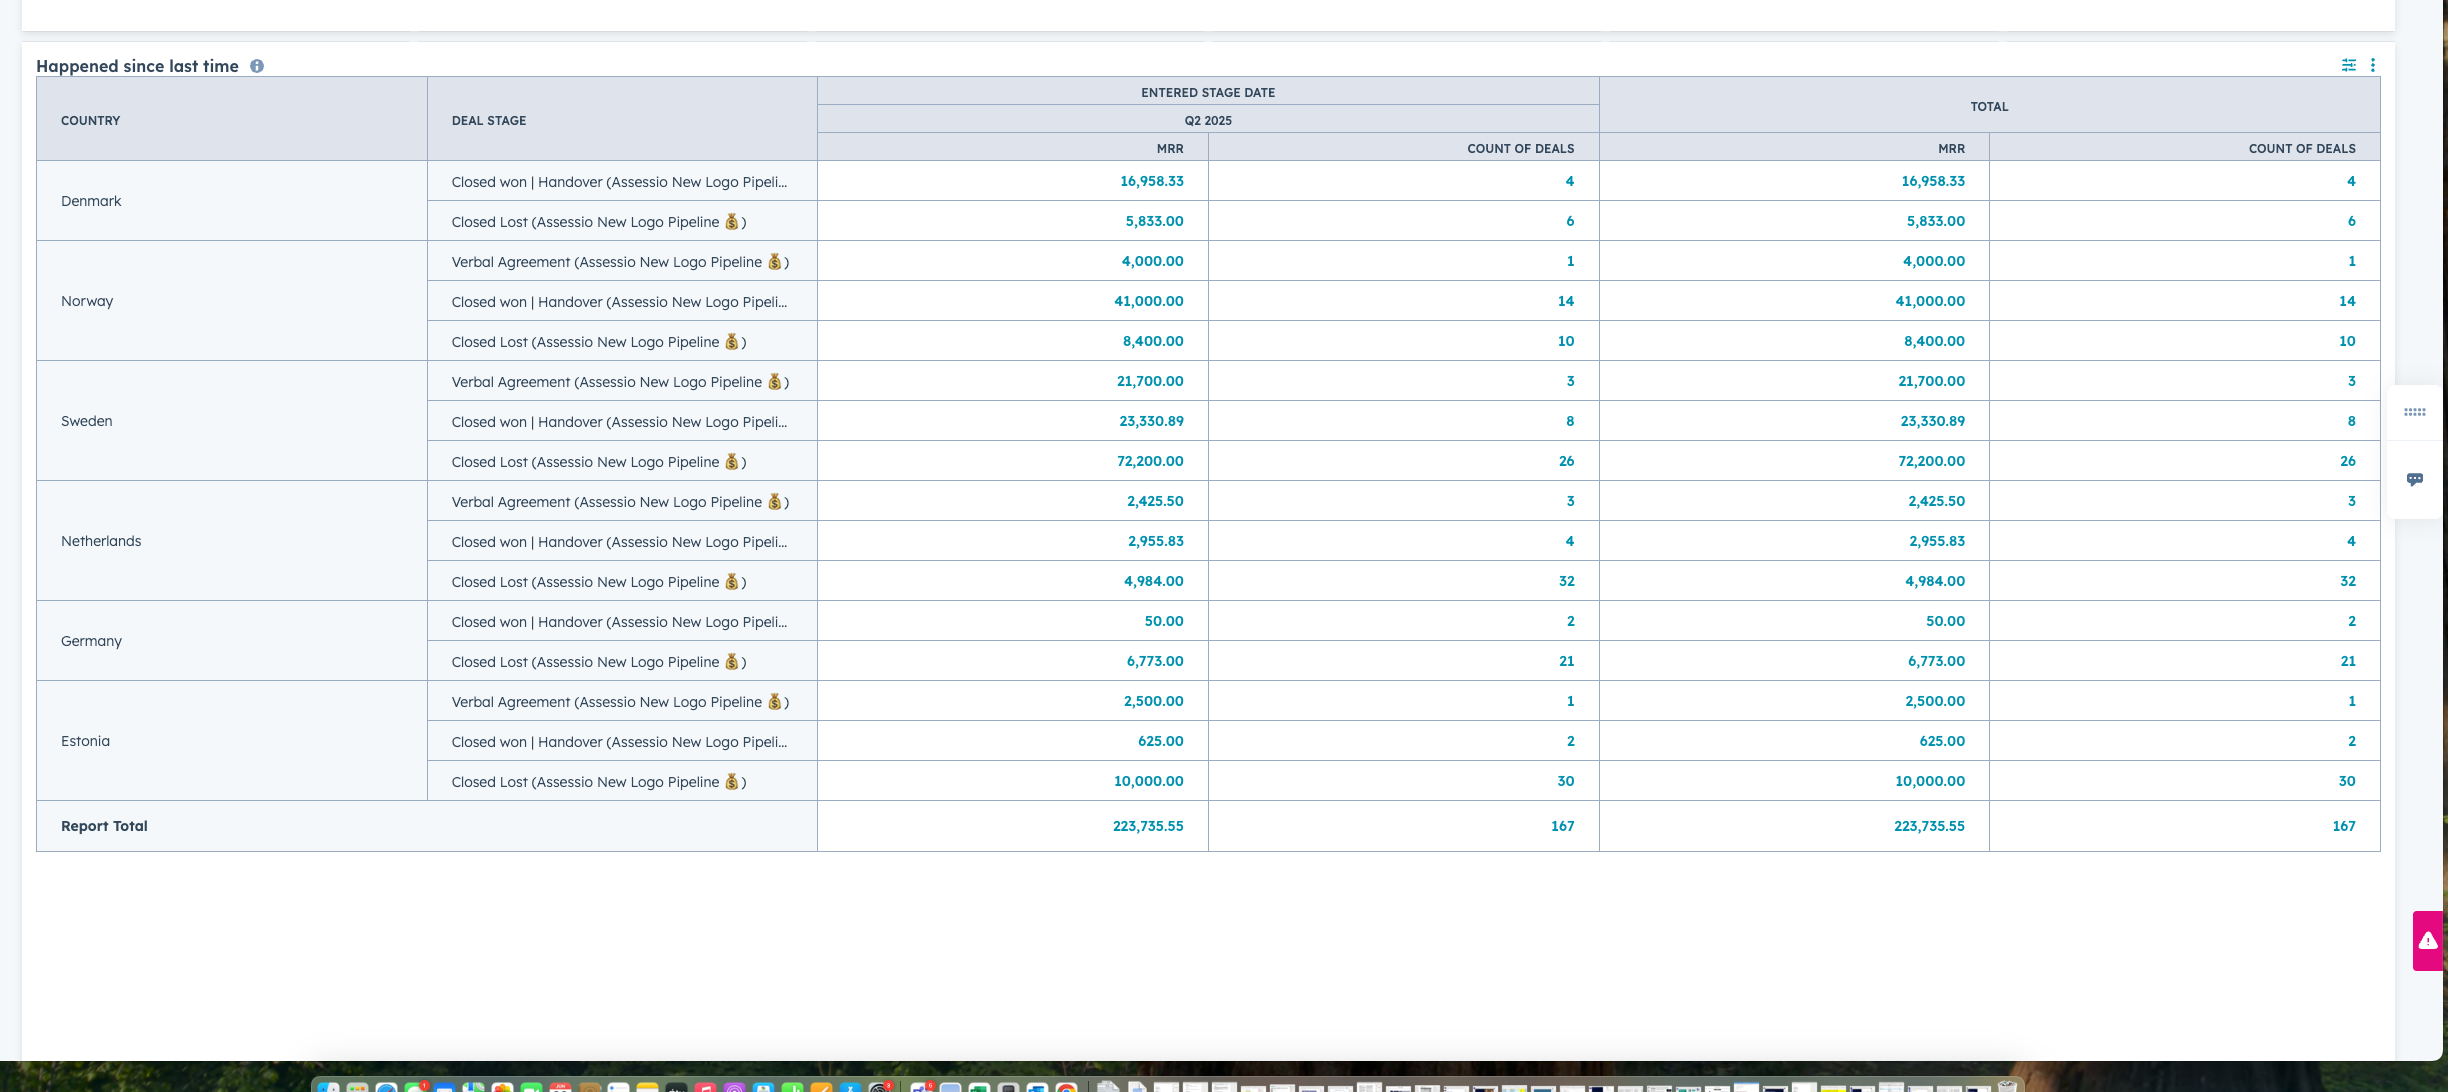
One special report here is "what happened since last time" where a date can be inputted and it will give you changes in the pipeline from that time
.png?width=670&height=299&name=image%20(26).png)
The bottom part with marketing data, is currently missing feedback from Mikkel
Territory planning
This dashboard is to give an overview of customers in the different countries, what products they have, what they do not have an use for cross/upsales potential
Adoption dashboard
Overview of important adoption metrics
Such as last time login per user
Total activites created across
New deals created
Avg time in pipeline
Vloxq quotes created month over month
AVG time to reply customers
Avg time to ticket close
Finance
-
Billing dashboard